Python Stock Market API in Action: Building Real-Time Quotes and Candlestick Charts with React, Supporting US Stock Historical Data Download
TickDB Research ·
Python Stock Market API in Action: Building Real-Time Quotes and Candlestick Charts with React, Supporting US Stock Historical Data Download
 Integrating a market data API typically requires just a few lines of request code. Putting A-shares, Hong Kong stocks, US stocks, forex, gold, indices, and crypto assets into a single usable page requires solving another set of problems: code ambiguity, different statistical windows for price changes, some instruments without trading volume, quotes that still return the last price after market close, and the last bar of historical candlesticks that may continue to change.
This article implements a cross-asset market data dashboard using React and Python. The left side has a filterable watchlist, and the right side displays current quotes, order book, tick-by-tick trades, and historical trends in sequence, supporting period switching, stock adjustment methods, and CSV download. Quotes update via WebSocket; order book and recent trades are queried per instrument; all upstream requests go through the Python service, with the API Key kept on the server.
This article's "full asset" scope is limited to stocks (A-shares, Hong Kong stocks, US stocks), forex, precious metals, indices, and crypto assets. One representative instrument is selected from each category, seven in total; covering asset classes doesn't mean loading all securities, nor does it include futures, options, or the complete bond market. This dashboard and screenshots use actual data returned from TickDB queries, defaulting to capture mode to read and save raw responses; live mode is for continuous access after configuring server keys, and demo is reserved only as an explicit synthetic test mode. Snapshots are real query results, not continuous real-time pushes.
Defining the Dashboard's Deliverables First
This version addresses continuous user tasks: finding the instrument to view, checking current quotes, order levels, and recent trades, verifying data definitions, then viewing and downloading historical trends.
| Page Area | Completed Task | Information to Preserve |
|---|---|---|
| Watchlist | Filter by asset class, search by code or name | Instrument type, price unit, price change window |
| Current Quote | View latest price, bid/ask prices, extended sessions | Quote time, quote age, session label |
| Order Book | View bid and ask prices and quantities at each level | Actual returned levels, book time, query time |
| Tick-by-Tick Trades | View recent trade price, quantity, time, side, and ID | Raw quantity definition, millisecond time, missing ID, result window |
| Historical Trends | Switch between minute, hourly, and daily, choose stock adjustment | Return count, actual start/end times, adjustment method |
| CSV Export | Download K-lines from current query | UTC time, query time, data mode, last bar hint |
| Status Area | Distinguish browser disconnection from upstream exceptions | Connection status, waiting for data, retry or stop reason |
The application uses only one Python process to maintain upstream subscriptions for the watchlist. The browser reads the current state from the backend via its own WebSocket connection, receiving one merged quote frame per second. This is the page refresh strategy for this example, not the upstream push frequency, nor tick data archiving.
The order book and tick-by-tick trades use independent REST queries: loaded when entering instrument details, waiting 3 seconds after completing one query before querying again, with the backend caching successful results for 3 seconds. The page displays the latest order book snapshot and the most recent 100 trades window; this refresh strategy should not be interpreted as per-event push or complete trade collection.
File division also stays straightforward: core.py stores instrument samples and pure data conversion, server.py handles REST, upstream WebSocket, caching, and browser interfaces, frontend/src.jsx handles React interactions, and style.css handles layout. Dependencies and startup commands are provided alongside the source code.
Organizing A-Share, HK Stock, US Stock, and Other Assets with Product Metadata
Exchange suffixes on stock codes only solve part of the identification problem. Gold and forex may belong to the same upstream product type but should appear in different categories on the page; index units are in points and cannot uniformly have a dollar sign appended.
Therefore, three concepts need to be distinguished: type for upstream requests, group for page categorization, and unit for value interpretation. For example, gold can use type=forex, group=Precious Metals; these serve different purposes and are not contradictory. The sample units in this article are configured per item and cannot be generalized as "inferring all security currencies from code suffixes".
INSTRUMENTS = [
    {"symbol": "600519.SH", "type": "stock", "group": "A-Share"},
    {"symbol": "700.HK", "type": "stock", "group": "HK Stock"},
    {"symbol": "AAPL.US", "type": "stock", "group": "US Stock"},
    {"symbol": "EURUSD", "type": "forex", "group": "Forex"},
    {"symbol": "XAUUSD", "type": "forex", "group": "Precious Metals"},
    {"symbol": "SPX", "type": "indices", "group": "Indices"},
    {"symbol": "BTCUSDT", "type": "crypto", "group": "Crypto"},
]
This is a tutorial watchlist, not a complete product catalog. When expanding to securities search, paginate through the products of the product query API, keeping symbol, type, market, currency, and is_active, and build the catalog from actual returned results. The API provides limit and offset; iterate according to pagination; do not treat the default first page as all products. An instrument appearing in the catalog doesn't mean the current account has real-time market data permissions for it.
When providing queries externally, the backend only accepts codes from the list, supported periods, and adjustment enums, not arbitrary upstream URLs from the browser. This clearly defines the tutorial scope while preventing the application from becoming an arbitrary request proxy.
Connecting Initial Snapshots and Continuous Updates to the Same State Table
After the page opens, it first needs displayable current state, followed by continuous changes. REST market snapshots are suitable for initialization and state repair after reconnection; WebSocket is suitable for continuous reception of new events; historical K-lines are for the detail page, queried independently on demand.
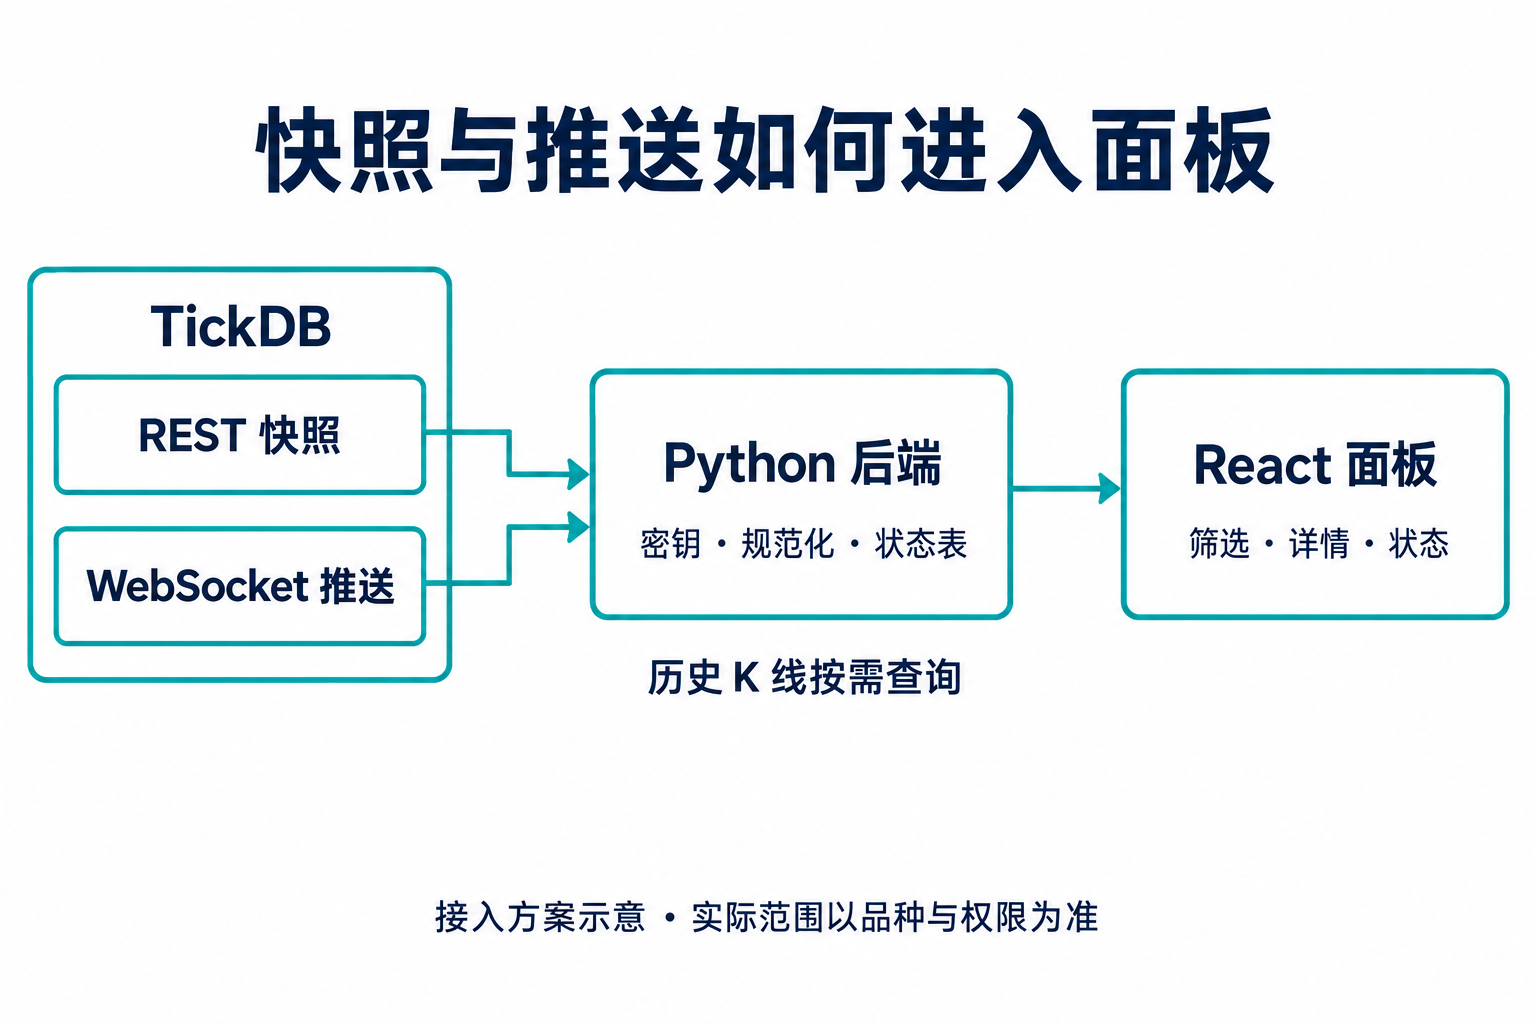
Figure 1: Data flow of the example application. The backend saves keys, normalizes data, and distributes to the browser; this is an integration architecture diagram, not a service provider's internal architecture or performance benchmark.
The following minimal request can first verify the request paths for the three-region stock market API. Environment variables should be configured on the server side, not written into React source code or VITE_ prefixed environment variables.
curl --fail-with-body --get \
  'https://api.tickdb.ai/v1/market/ticker' \
  -H "X-API-Key: ${TICKDB_API_KEY}" \
  --data-urlencode 'symbols=600519.SH,700.HK,AAPL.US' \
  --data-urlencode 'type=stock'
After HTTP success, still check if the business code in the JSON is 0. A normal snapshot can query up to 50 codes at once; when scaling, batch and schedule according to account limits. This example queries and subscribes separately by stock, forex, indices, and crypto, avoiding misapplying type=stock to mixed assets.
The Python request entry point can be centralized into one function with unified timeout, authentication, and error handling:
async def fetch_data(client, path, params, api_key):
    response = await client.get(
        "https://api.tickdb.ai" + path,
        params=params,
        headers={"X-API-Key": api_key},
        timeout=15,
    )
    response.raise_for_status()
    payload = response.json()
    if payload.get("code") != 0:
        raise RuntimeError(f"Upstream code: {payload.get('code')}")
    return payload["data"]
This snippet requires an httpx.AsyncClient; the complete backend creates and closes it via FastAPI lifecycle. Don't create a new set of upstream connections for each instrument or browser page; this example shares one state table with a clear sample scope.
Preserving Missing Values and Statistical Windows When Normalizing Fields
The most common error in cross-asset market dashboards is displaying missing returned values as zero. Forex has bid/ask prices, but that doesn't mean it has trading volume in the same definition as stocks; indices only return price and time, and shouldn't be forcibly filled with a set of price change data.
Prices are kept as decimal strings during transmission and storage, converted to JavaScript values only when actually drawing. The following conversion preserves "0" while rejecting empty values, booleans, NaN, and infinity:
from decimal import Decimal, InvalidOperation

def number(value):
    if value is None or isinstance(value, bool):
        return None
    if str(value).strip() == "":
        return None
    try:
        value = Decimal(str(value))
        return str(value) if value.is_finite() else None
    except InvalidOperation:
        return None
Field names like volume_24h can't replace business interpretation. The current documentation interprets crypto asset common definitions as rolling 24 hours, while traditional markets typically use current day or current trading session. Therefore, the page keeps a window label for each price change percentage, without putting all seven instruments into a mixed gainers table. If forex bid/ask spread is used for display, it can calculate ask - bid, but cannot label it directly as "points" without instrument tick value metadata.
Main snapshots and US stock extended sessions need separate storage. REST pre-market, after-hours, and night sessions are nested objects; WebSocket extended session messages are identified by trade_session; the normalized key uses type:symbol:session. This way, night session prices won't overwrite the main snapshot but continue carrying the main snapshot's volume or price change.
When regular messages don't have an extended session label, this example uses base, and the page calls it "Main Snapshot", without inferring that the exchange is in regular trading at this moment.
Handling Forex WebSocket Out-of-Order Messages and Disconnection Recovery
Below is a minimal subscription example for a single forex instrument, requiring the websockets library and server key. It's used to see the relationship between connection, subscription, and receiving messages; the complete project then adds recovery, state table, and browser distribution. Don't log connection URLs containing keys.
import asyncio
import json
import os
from urllib.parse import urlencode
from websockets.asyncio.client import connect

async def main():
    query = urlencode({"api_key": os.environ["TICKDB_API_KEY"]})
    url = "wss://api.tickdb.ai/v1/realtime?" + query
    async with connect(url, ping_interval=20, ping_timeout=20) as ws:
        await ws.send(json.dumps({
            "cmd": "subscribe",
            "data": {
                "channel": "ticker", "type": "forex",
                "symbols": ["EURUSD"],
            },
        }))
        async for raw in ws:
            message = json.loads(raw)
            if message.get("cmd") == "ticker":
                print(message["data"])
            elif message.get("cmd") == "error":
                raise RuntimeError("Subscription error, please check return code and permissions")

asyncio.run(main())
The real challenge for forex WebSocket integration is how messages enter the state table. First save the latest event time, then decide whether new messages can overwrite old state:
def apply_quote(book, row):
    if row is None:
        return False
    old = book.get(row["key"])
    if old and row["event_ms"] < old["event_ms"]:
        return False
    book[row["key"]] = row
    return True
This code uses full observation replacement. If a new message has no bid price, volume, or price change, display as missing, without quietly carrying forward optional fields from the previous message. The benefit is clear semantics; the cost is that some fields may temporarily become —. A production system that wants to preserve these fields needs to save each field's own update time and source.
Messages with the same timestamp overwrite in arrival order. This is an explicit tradeoff: without a server monotonic sequence number, millisecond timestamps are insufficient to prove strict ordering of two events. What is implemented here is latest state display and cannot be described as zero-loss tick-by-tick or strictly ordered system.
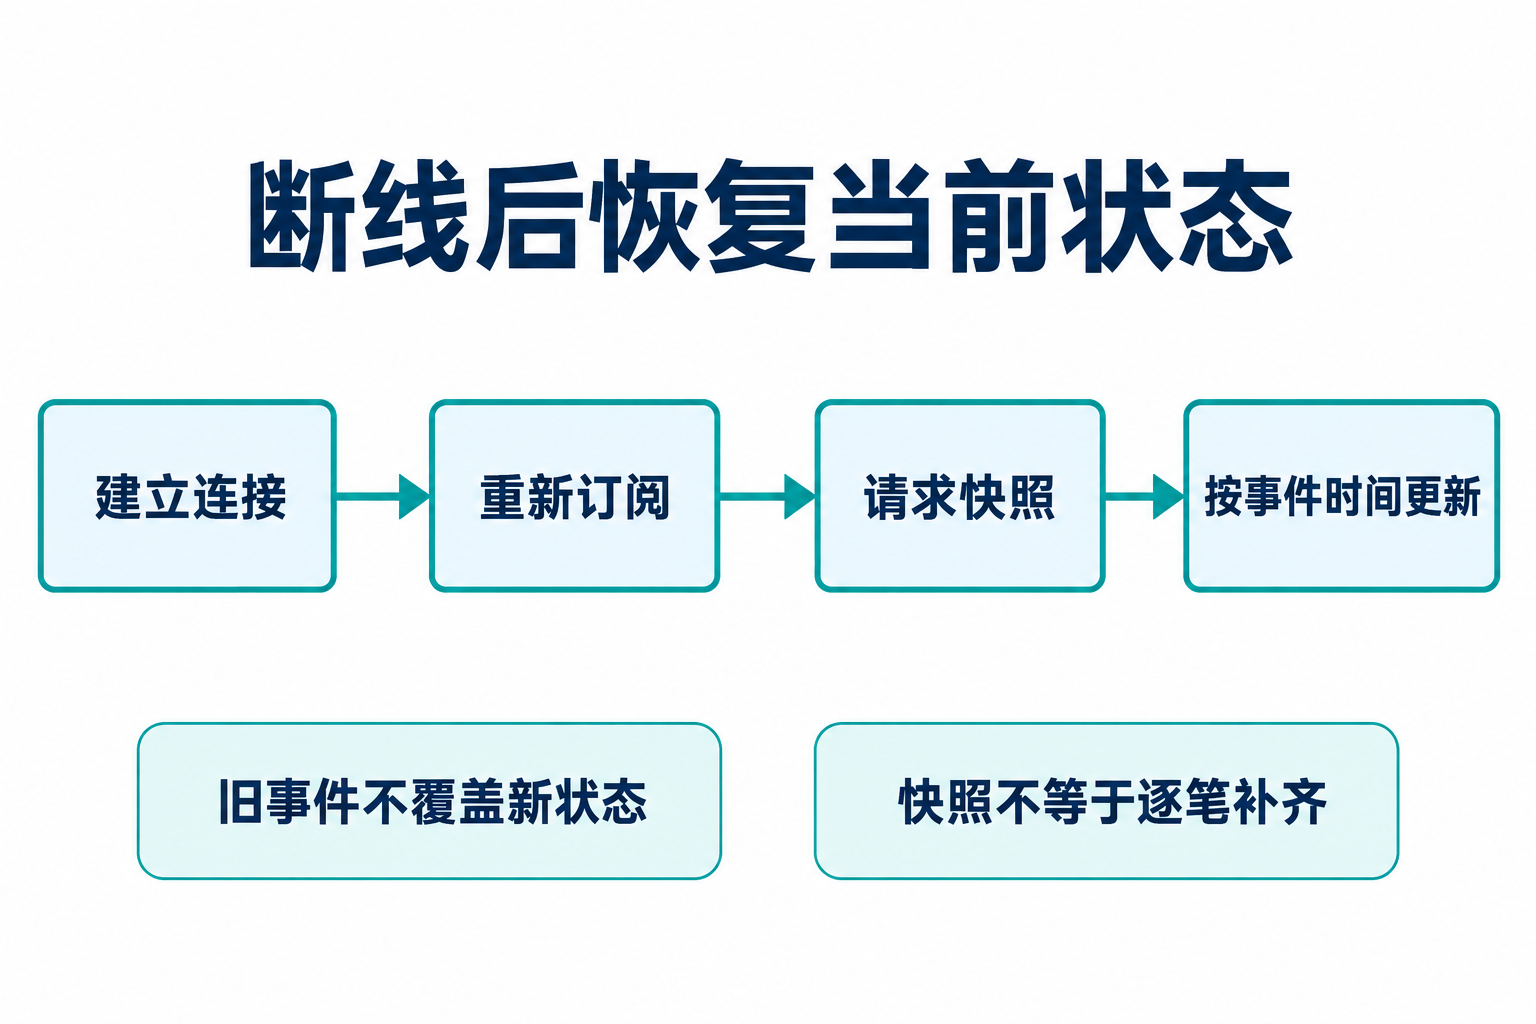 Figure 2: Steps to recover current state after reconnection. The snapshot fill only repairs the latest state, not proving that all trade events during disconnection have been filled.
The complete backend processes connections in this order: establish WebSocket, send subscriptions by type, then request REST snapshot, finally read messages from the connection buffer. Stream messages and snapshots both go through the same event time check; earlier messages won't cause displayed prices to roll back. The Python client buffers messages while fetching the snapshot; the buffer queue has an upper limit; this is not infinite event storage.
After connection recovery, resubscribe. Network disconnection and retryable service errors wait at 1 second, 5 seconds, 30 seconds; stop automatic retry on authentication, permission, or unknown business errors, displaying the error code. Upon receiving 429, also check limits; production deployment can further follow Retry-After to avoid misconfiguration causing continuous requests.
The example uses WebSocket protocol-level Ping to detect inactive connections. Protocol heartbeat being normal only means the connection is still responsive; some instruments may be closed, have no new trades, lack permissions, or be unsubscribed. Therefore, the page separately displays browser-to-backend connection status, backend upstream status, and quote time for each quote.
"Quote age" is calculated as current time minus event time. It is affected by trading activity, market session, upstream time semantics, and local clock, and cannot be called network latency. Closed market status requires trading calendar and trading session evidence; this example doesn't directly judge "no update for over 60 seconds" as abnormal or closed.
Separating Current Quotes, Order Book, and Tick-by-Tick Trades into Three States
Current quotes answer "what is the latest price"; order book answers "what are the returned bid/ask prices and quantities at each level"; tick-by-tick trades answer "what trades just occurred". These three require different data models. Price changes cannot automatically generate a trade, and order book quantity decreases cannot directly infer trading volume.
The page always preserves three areas, but whether data can be displayed depends on instrument and permissions. The current example integrates order book and trade queries for three-region stocks and crypto assets. Forex, precious metals, and indices are not in the support market list for these two items in the API documentation used this time, so display "This capability is not configured" rather than creating blank five levels; existing bid/ask for forex and precious metals still go in the current quote area. Documentation not listing something doesn't mean all providers lack this data.
First verify the order book structure for a Hong Kong stock instrument with the following request:
curl --fail-with-body --get \
  'https://api.tickdb.ai/v1/market/depth' \
  -H "X-API-Key: ${TICKDB_API_KEY}" \
  --data-urlencode 'symbol=700.HK' \
  --data-urlencode 'type=stock'
The order book returns bids and asks, with each level being [price, quantity], plus instrument and millisecond timestamp. During conversion, verify returned instrument, price, quantity, and time, then sort bids descending by price and asks ascending by price. Prices preserve decimal strings; zero quantity and missing fields are handled separately. This article uses REST full responses, replacing the current display window each time, without inferring it as incremental order book that needs accumulating.
The interface displays up to 10 levels per side, with "Actual upstream returned levels" listed separately. When only bid1/ask1 exist, draw only one row without filling non-existent bid2 or ask2. When one side is empty but the other has records, the missing side displays —; only when both sides are empty display "No records returned for this query". Actual available levels are determined by market, instrument, and permissions; during online integration, use the response as authoritative.
Tick-by-tick trades use an independent API and cannot be assembled from ticker cumulative volume differences:
curl --fail-with-body --get \
  'https://api.tickdb.ai/v1/market/trades' \
  -H "X-API-Key: ${TICKDB_API_KEY}" \
  --data-urlencode 'symbol=700.HK' \
  --data-urlencode 'type=stock' \
  --data-urlencode 'limit=100'
The trade table keeps price, quantity, timestamp, side, and available id, displayed in reverse chronological order by event time. Side only translates upstream buy, sell, neutral, without deriving aggressive buying, fund flow, or main force behavior. Before confirming quantity units, display raw values without arbitrarily labeling as "shares" or multiplying "lots" by 100. Multiple trades with the same millisecond preserve returned order without claiming to have determined strict ordering.
The recent trades window is replaced entirely each time to avoid polling overlap being duplicated. Within a single response, deduplicate only records with ID and matching ID and time; records without ID but with same time, price, and quantity are still preserved because they may be two real trades. React row keys can use positions in the current window, which are only interface keys and cannot masquerade as exchange trade IDs.
The backend separately caches and processes these two request paths. micro_channel converts normal results, empty results, and error results into different states; the following aggregation entry allows one path to fail while the other continues displaying:
async def fetch_microstructure(symbol):
    depth, trades = await asyncio.gather(
        micro_channel(symbol, "depth"),
        micro_channel(symbol, "trades"),
    )
    return {"symbol": symbol, "depth": depth, "trades": trades}
This uses the already imported asyncio and the backend's micro_channel. The complete /api/microstructure entry also checks the watchlist and instrument capabilities, and uses single-instrument locks to merge concurrent cache fills. Order book permission failures only display error codes in that area, not affecting quotes or the trade table; failed results are cached for 60 seconds to avoid every page refresh immediately requesting failed upstream. The current documentation lists order book and tick-by-tick trades as unavailable capabilities for free tier; successful free snapshot cannot be used to infer these two paths also have permissions.
The frontend's useMicrostructure schedules the next request after one request ends, avoiding timer accumulation from slow requests. Switching instruments cancels old requests, clears timers, and immediately hides old instrument data. Both areas respectively display event time or tick time plus query time, without using "query just completed" to impersonate "trade just occurred".
If the product requires displaying each new trade upon arrival, continue integrating depth and trade WebSocket channels, noting that the trade channel name is singular trade while the REST path is plural trades. The current documentation's Hong Kong stock, US stock, and crypto asset trade pushes use data.trades array, while A-share pushes place single trade fields directly in data, requiring the adapter to handle separately. The order book and trades areas implemented in this article use REST polling and have not written this extended path as completed streaming capability.
The most recent 100 trades may cover several minutes or only a very short active period. Querying recent records after reconnection only repairs the visible window; complete tick-by-tick collection still requires explicit sequence, backfill capability, deduplication boundaries, and persistence verification.
React Only Maintains Interface State, Not Directly Holding Keys
The browser connects to the application's /ws, receiving unified data output from the backend. For seven samples, sending the entire current state table once per second is easier to verify than maintaining a complex incremental protocol; when state volume grows, consider visible instrument subscription, incremental frames, and virtual lists.
React filtering and search are derived results that won't change server subscriptions or delete currently selected details. The interface uses real buttons to switch instruments, providing keyboard focus, empty results, and error hints; on narrow screens, the list and details stack vertically.
Historical queries need special handling for request race conditions. If a user clicks Apple first, then Tencent, the slow response from Apple arriving last should not overwrite the current Tencent chart. The following Effect simultaneously cancels old requests and prevents old callbacks from writing to state:
useEffect(() => {
  const controller = new AbortController();
  let active = true;
  setHistory({ loading: true, data: null, error: null });
  fetch(`/api/kline?${params}`, { signal: controller.signal })
    .then(async response => {
      const body = await response.json();
      if (!response.ok) throw new Error(body.detail || "Query failed");
      return body;
    })
    .then(data => {
      if (active) setHistory({ loading: false, data, error: null });
    })
    .catch(error => {
      if (active && error.name !== "AbortError") {
        setHistory({ loading: false, data: null, error: error.message });
      }
    });
  return () => {
    active = false;
    controller.abort();
  };
}, [params]);
Here params is a stable query string generated from instrument, period, and adjustment method; setHistory is the component state update function. The complete example's useHistory also contains requery trigger parameters. During switching, the old chart is cleared to avoid briefly displaying the old instrument's curves under the new title. The React official Effect documentation also emphasizes canceling requests or ignoring stale results in the cleanup function. React Effect Official Documentation
The WebSocket Effect also needs cleanup: close the connection and cancel reconnect timers when the component unmounts. Otherwise, repeated mounting during development or page navigation may leave multiple connections.
US Stock Historical Data Download Starts from Explainable Query Results
The historical download feature is more than just adding an export button. Readers need to know what instrument, what period, what adjustment, when queried, and whether results are complete.
The example detail defaults to requesting the most recent 200 K-lines, providing three page options: 1m, 1h, 1d. The backend restricts code, period, and return count; stocks allow none, forward, backward, while other assets only accept none. Cache keys include instrument, type, period, adjustment method, and count; cannot use only the security code, otherwise daily and minute, forward-adjusted and unadjusted would be mixed.
curl --fail-with-body --get \
  'https://api.tickdb.ai/v1/market/kline' \
  -H "X-API-Key: ${TICKDB_API_KEY}" \
  --data-urlencode 'symbol=AAPL.US' \
  --data-urlencode 'type=stock' \
  --data-urlencode 'interval=1d' \
  --data-urlencode 'adjust=none' \
  --data-urlencode 'limit=200'
After receiving K-lines, sort by millisecond timestamp, deduplicate for the same timestamp, and check low ≤ open/close ≤ high. Abnormal records don't enter the chart, and the page displays the excluded count. Each K-line keeps its own timestamp; the chart uses equally spaced trading entries, without filling gaps for periods not returned. Therefore, the screen distance between adjacent bars doesn't represent actual elapsed time; specific times are based on the horizontal axis and crosshair cursor labels.
Drawing Standard Candlestick Charts with OHLC Data
Standard K-lines need complete open, high, low, and close prices. The body ends correspond to open and close, and wicks extend to high and low. This example uses Lightweight Charts 5.2.1, drawing rising K-lines in red (close not lower than open), falling in green, with volume in a separate sub-chart. Colors compare the open and close prices of the same K-line, not compared to the previous K-line's close.
Below is the core code for field mapping. bars is the result after backend cleaning; the page needs to pre-provide <div id="chart"></div> container. API timestamps are in milliseconds; the chart uses UTC seconds; only divide by 1000, without manually adding or subtracting timezone offsets.
import {
  createChart, CandlestickSeries, HistogramSeries,
} from 'lightweight-charts';

const chart = createChart(document.getElementById('chart'), {
  height: 400, layout: { attributionLogo: true },
});
const candles = chart.addSeries(CandlestickSeries, {
  upColor: '#c84c52', downColor: '#188877', borderVisible: false,
  wickUpColor: '#c84c52', wickDownColor: '#188877',
});
candles.setData(bars.map(b => ({
  time: b.time / 1000,
  open: Number(b.open), high: Number(b.high),
  low: Number(b.low), close: Number(b.close),
})));
const volume = chart.addSeries(HistogramSeries, {
  priceFormat: { type: 'volume' },
}, 1);
volume.setData(bars.filter(b => b.volume != null).map(b => ({
  time: b.time / 1000, value: Number(b.volume),
  color: Number(b.close) >= Number(b.open) ? '#c84c5280' : '#18887780',
})));
chart.panes()[1].setHeight(100);
chart.timeScale().fitContent();
The complete component is in KlineChart.jsx; volume conversion also excludes empty strings, non-finite values, and negative numbers; valid zero values are preserved as-is. When all volume is missing, the volume sub-chart is not created and the legend displays —, without drawing "zero volume for the whole day" for data sources without volume. JavaScript values converted for drawing are used only for rendering; CSV continues using raw decimal strings.
The chart enables crosshair cursor, mouse wheel zoom, drag pan, and zoom in, zoom out, reset view buttons. subscribeCrosshairMove maps the current time back to the original K-line, letting the legend display corresponding open, high, low, close, volume. Date labels are displayed via Intl.DateTimeFormat per instrument timezone; data itself preserves UTC time; price axis precision is not treated as the exchange minimum price increment.
React creates the chart in an Effect; when instrument, period, or adjustment results change, new data is loaded; during cleanup, cancel callbacks and call chart.remove(), while releasing the canvas and auto-size observer. This article draws the current historical query results, without using tickers to splice unverified real-time K-lines. Related API and pane methods are at Lightweight Charts Official Getting Started and Multi-Pane Examples. The page preserves TradingView's chart attribution and links.
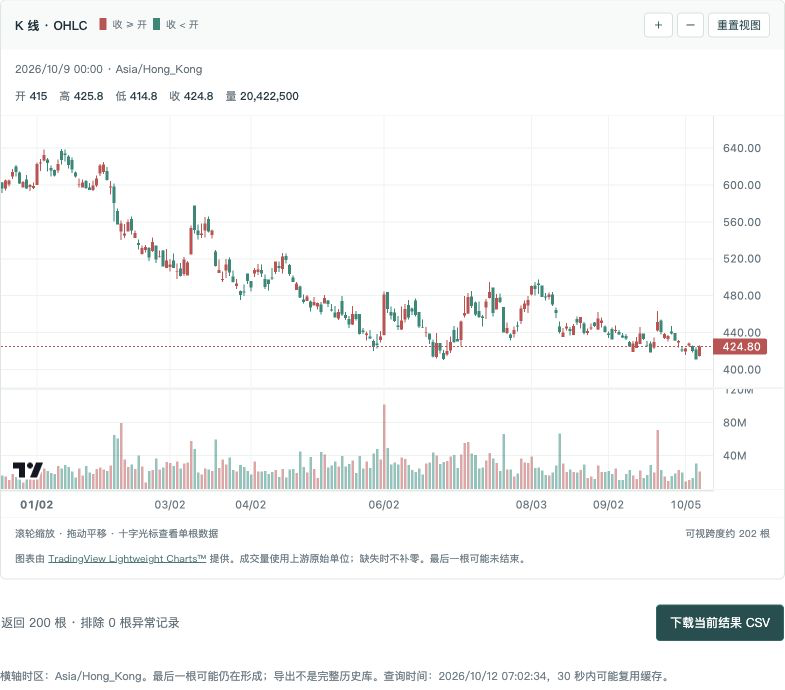
Figure 3: Running effect of 200 real query daily K-lines for Tencent Holdings. Last bar date is 2026-10-09, open 415, high 425.8, low 414.8, close 424.8, raw volume 20422500; query time is Beijing time 2026-10-12 07:02:34. No adjustment; price chart and volume chart share the same time axis.
The current API documentation states that the last K-line may still be forming, so the page always preserves a hint and marks the last row in CSV as last_bar_may_be_open=true. This is only a conservative hint, not equal to the server providing per-bar confirmed end flags. Don't arbitrarily append the latest ticker price as a "historical closed K-line".
The download button exports current results, preserving symbol, interval, adjust, UTC time, OHLCV, query time, and mode. Numbers saved in code are not first recalculated via floating point, and rounding during interface display is not written back to exported data. Synthetic mode file names and content both carry demo identification.
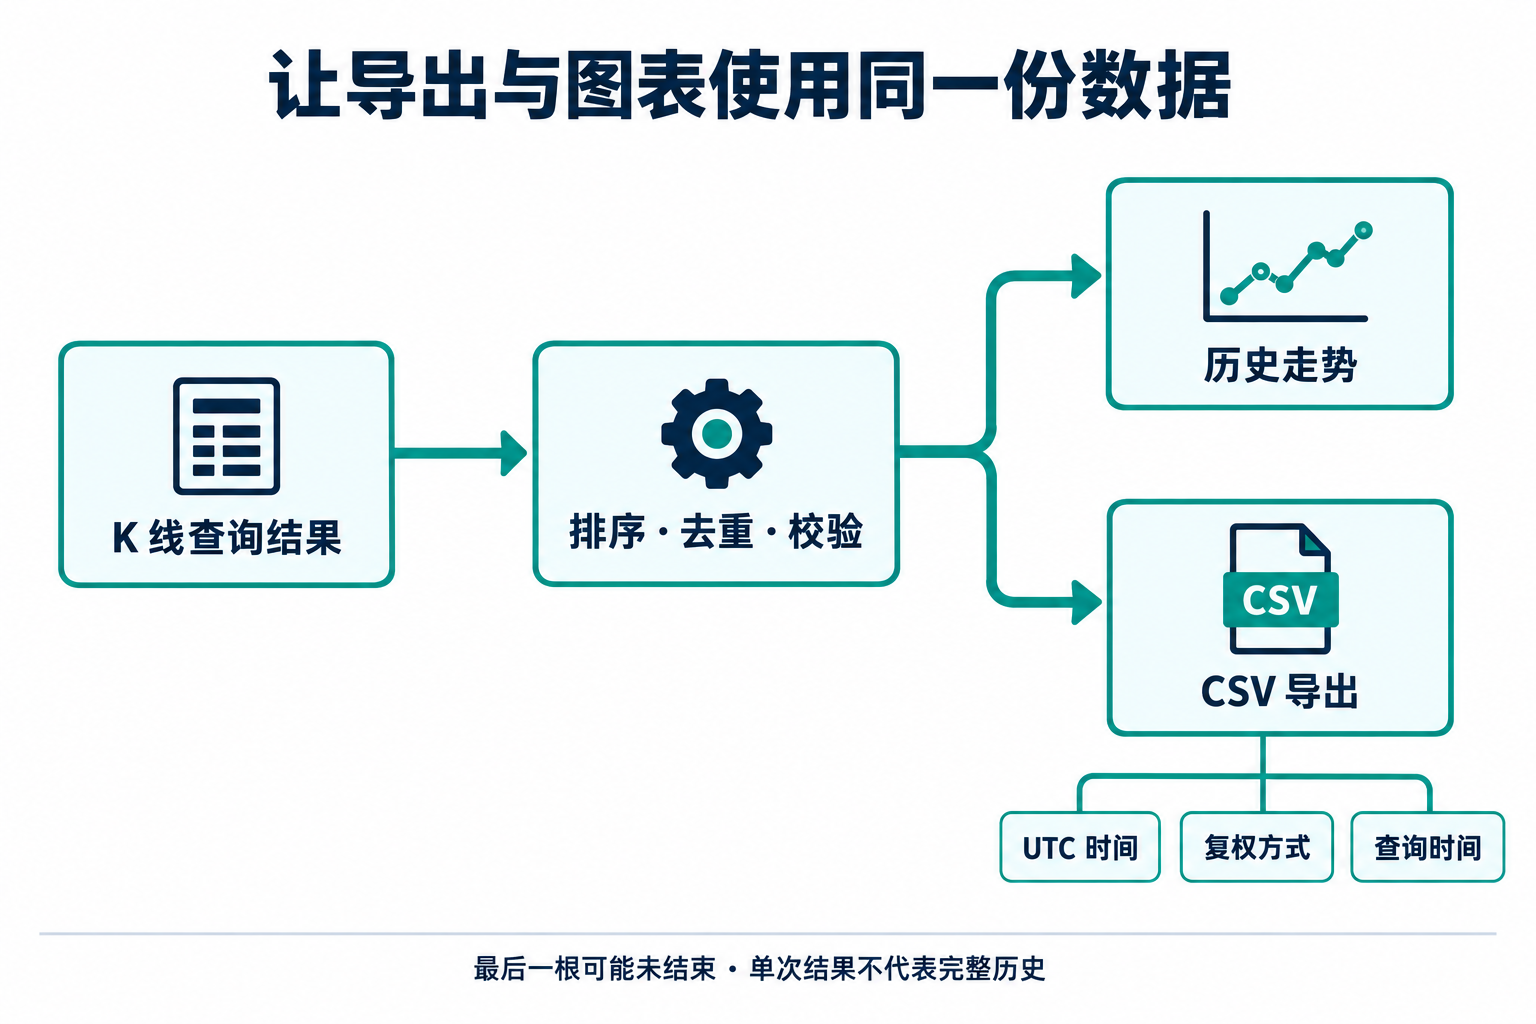
Figure 4: Chart and export use the same cleaned result set; export preserves query definitions. The K-line count from a single return doesn't prove the historical range is complete.
If the goal is to download complete multi-year US stock historical data, a resumable archival task should be built separately: first confirm the account allows start_time, end_time, then slice by bounded time windows; record request boundaries, returned start/end, counts, and query times for each segment; preserve overlaps between adjacent segments and deduplicate; when hitting the single request limit, continue shrinking the window until coverage can be clearly verified. The current documentation's K-line single request limit is 1000; free tier doesn't support specifying start and end time. Cannot claim to have downloaded complete multi-year history with a single limit=1000.
Stock historical archiving should also record adjustment method and query timestamp: corporate actions or data revisions may change historically adjusted prices. This article delivers browsable, exportable recent results, without implementing multi-year archival, trading day completeness audit, or total return backtesting.
What Was Actually Queried This Time
Beijing time 2026-10-12 07:02–07:03, through the configured TickDB connector, 19 queries were actually completed: 4 quote requests grouped by product type, 7 daily K requests, and 1 order book and 1 recent trades request each for three-region stocks and Bitcoin. All 19 responses had business code 0. The source code's app/data/tickdb-capture.json saves request parameters, start and end times, and complete return content, not including the API Key.
Quote return values are: Kweichow Moutai 1263 CNY, Tencent Holdings 424.8 HKD, Apple 336.64 USD, EURUSD 1.11967, XAUUSD 4186.44000, SPX 7811.54000, BTCUSDT 83736.01000000. These are prices corresponding to their respective event times and cannot be understood as synchronized quotes at the same moment.
Seven instruments each returned 200 unadjusted daily K-lines. Stocks and Bitcoin returned in ascending time order this time; forex, gold, and indices returned in descending order, so sorting is required before entering the chart. Tencent's last daily K-line close is 424.8, consistent with this time's main quote; this is only one sample verification and cannot be generalized as all API moments being consistent.
Order book results also vary: Moutai has 5 levels each for bid and ask, Tencent has 10 levels each, Bitcoin has 1000 levels each; the page displays up to 10 levels per side. Apple's this request succeeded but both bid and ask arrays are empty; the page displays "No records returned for this query", not filled as zero or inferred as permanently unsupported. Four instruments' recent trades each returned 100 records, displayed in reverse chronological order by event time. Forex, precious metals, and indices are outside this example's order book and trades integration scope.
capture mode only opens this actual daily K, unadjusted combination; other period and adjustment options are disabled, and the backend also rejects uncollected combinations. Re-reading snapshots won't update the original query time. To continuously request new market data, switch to live mode below and configure keys on the server.
Starting and Verifying the Dashboard
Python 3.11+ and Node.js 22.12+ are recommended. First install backend dependencies and start in the source code's app directory. The default real query snapshot mode doesn't require local keys and reads the original responses provided with the source code:
python3 -m venv .venv
source .venv/bin/activate
pip install -r requirements.txt
APP_MODE=capture uvicorn server:app --host 127.0.0.1 --port 8000
Open another terminal and enter the frontend project in the same app directory:
cd frontend
npm ci
npm run dev
Open http://127.0.0.1:5173. Vite forwards /api and /ws to the local Python service. Production build uses npm run build; after build completes, restart the backend and access static pages via http://127.0.0.1:8000. This article is verified for single-process, single-user local operation; multi-process deployment requires external shared market state and cannot directly replicate multiple upstream connections.
For online mode, first set TICKDB_API_KEY in the terminal environment where the service starts, then stop the original backend and restart with the following command. Without the key, startup is refused without falling back to synthetic data:
APP_MODE=live uvicorn server:app --host 127.0.0.1 --port 8000
The backend currently binds to the loopback address for local use, and WebSocket is also restricted to local origins. Before serving externally, add login, user permissions, data display authorization, request quotas, reverse proxy TLS, and log masking, then adjust allowed origins. Don't just change the listening address to 0.0.0.0 and expose the shared key-supported market data proxy.
Below is the actual running desktop interface of the accompanying React + Python application, displaying ten levels of order book and recent trades for Hong Kong stock details. The left is the cross-asset watchlist, the right displays current quotes, order book, tick-by-tick trades, and historical trends in sequence, with CSV download at the bottom.
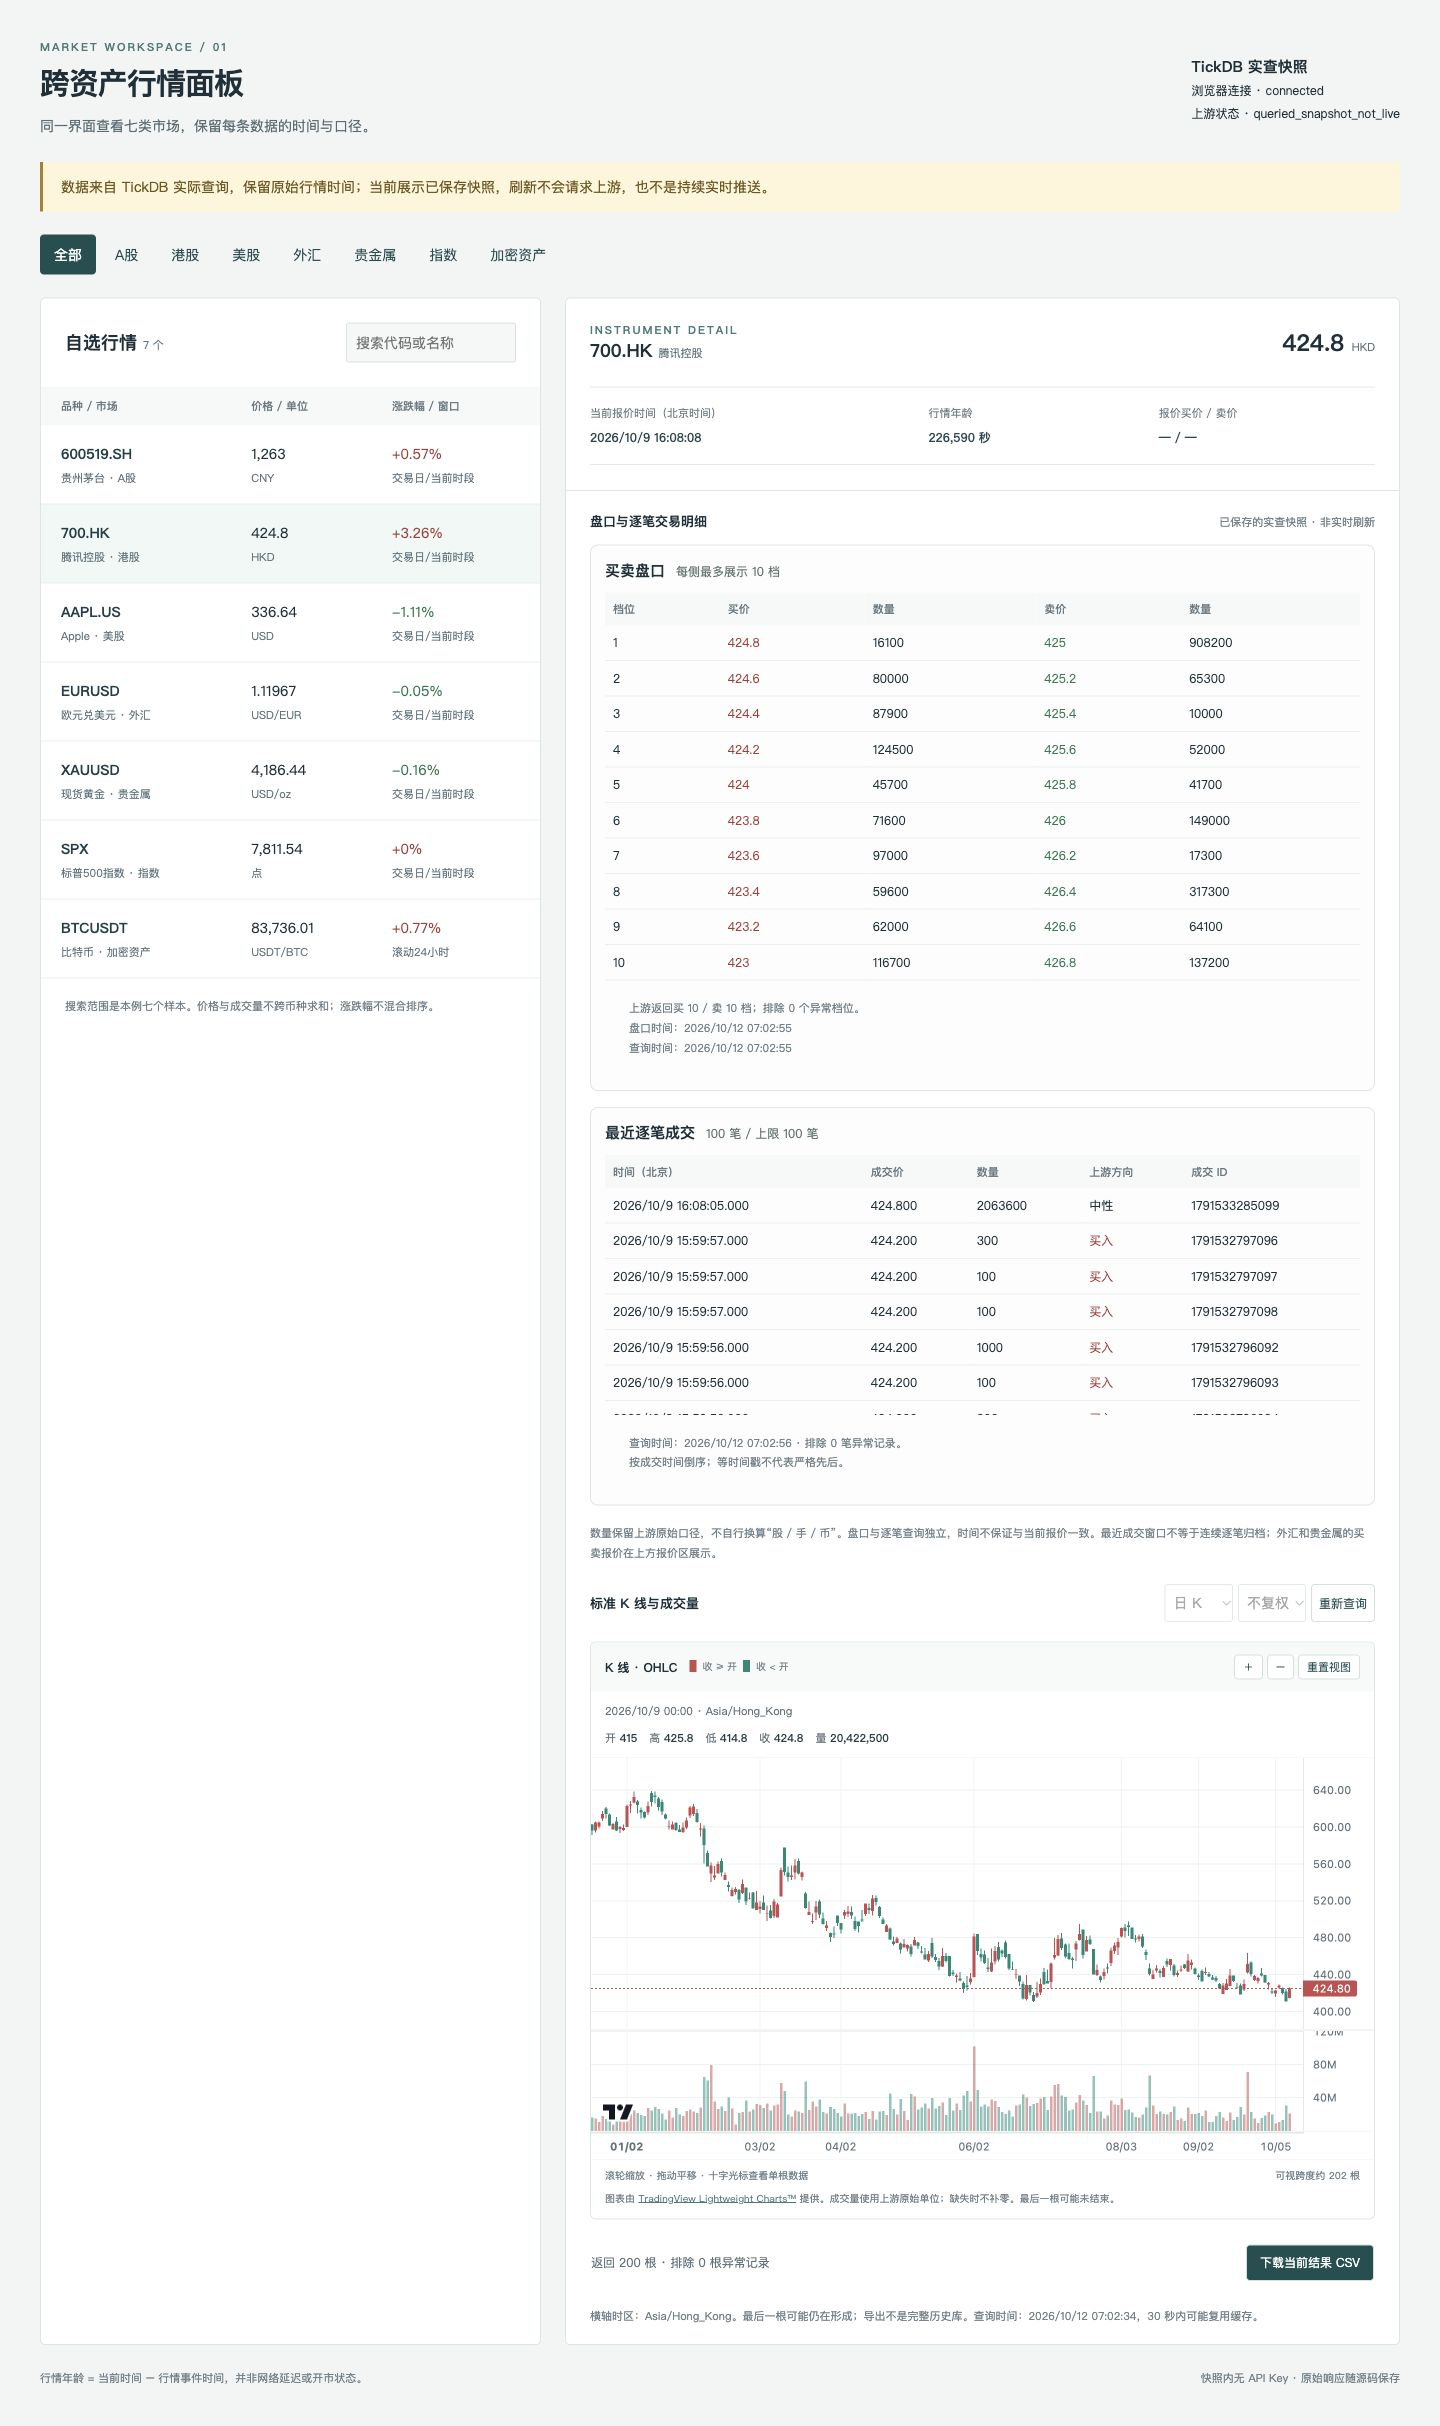
Figure 5: Actual running screenshot of the final dashboard, using TickDB real query saved snapshots. Tencent quote is 424.8 HKD; order book returns 10 levels each for bid and ask; trades return 100 records; daily K returns 200 bars. Each module preserves its own event time and query time; the screenshot doesn't represent continuous real-time push.
During acceptance testing, check along actual operations:
- Switch through seven asset categories, confirm each sample can enter details, and verify empty state display when search has no results.
- Quickly switch between AAPL.US and 700.HK, confirm old responses don't overwrite the current chart.
- Check quotes, order book, and tick-by-tick trades three areas; single-level responses don't fill five levels; trade price, quantity, millisecond time, and side all come from trade records.
- Switch forex, precious metals, and indices, confirm quotes still display, order book and trades display capability notes; simulate order book permission failure, confirm trade table and quotes remain usable.
- Switch minute, hourly, daily, and stock adjustment, confirm request parameters and cache keys change synchronously.
- Check candlestick bodies, wicks, and volume bars; use crosshair to verify single-bar OHLC; verify zoom, reset, and that missing volume isn't filled as zero.
- Use missing values, zero values, out-of-order messages, and night session messages to verify conversion; confirm empty values aren't zero, old events don't overwrite new events, night sessions don't overwrite main snapshot.
- Close the backend, confirm the browser shows disconnection and preserves old data; after restoring the backend, confirm reconnection. Old data always preserves original event time.
- Download CSV, check that data mode, adjustment, UTC time are consistent with the current chart, and the last bar preserves the may-not-be-ended hint.
The accompanying verification materials preserved 19 successful TickDB actual query responses, request parameters, query start and end times, and panel conversion and CSV reconciliation results. Queries were completed through the configured TickDB connector; local Python defaults to reading these snapshots. This time, local Python to upstream WebSocket continuous subscription acceptance wasn't completed, nor was full market coverage, continuous online duration, or end-to-end quote latency measured.
This dashboard gives current quotes, order book levels, and tick-by-tick trades their own data entry points and timing information, and also lets every price answer "which instrument, which session, what statistical window, corresponding to what time". When expanding to more watchlist instruments, following these clear boundaries ensures every new column added to the interface has verifiable meaning.