Building a Three-Market Stock Dashboard with TickDB: From Market Data APIs to an Interactive Page
TickDB Research ·
Building a Three-Market Stock Dashboard with TickDB: From Market Data APIs to an Interactive Page
Put your watchlist of A-shares, US stocks, and Hong Kong stocks on a single page—quotes on the left, price charts on the right when you click—with search and sorting capabilities. This is an ideal small project after connecting to a market data API.
This time we built a local market dashboard with TickDB: Python provides the server-side endpoints, and vanilla JavaScript renders the page—no frontend build tools required. It displays snapshots of six sample stocks, supports filtering by market, searching by code, sorting by price change percentage, and shows historical daily K-line closing price charts when you click on a stock.
Let me clarify the validation scope: the page has been run on this machine, and the screenshots are from an actual browser. The screenshots use TickDB real responses collected and saved on September 28, 2026, and the page is clearly labeled "Real Sample Replay · Non-Real-Time." The same example includes a REST online mode, but since the runtime environment doesn't have a server-side API Key, the online mode has not completed real REST direct connection validation. Sampling success, page operation success, and online direct connection success are three separate validations.
First, Here's the Finished Page
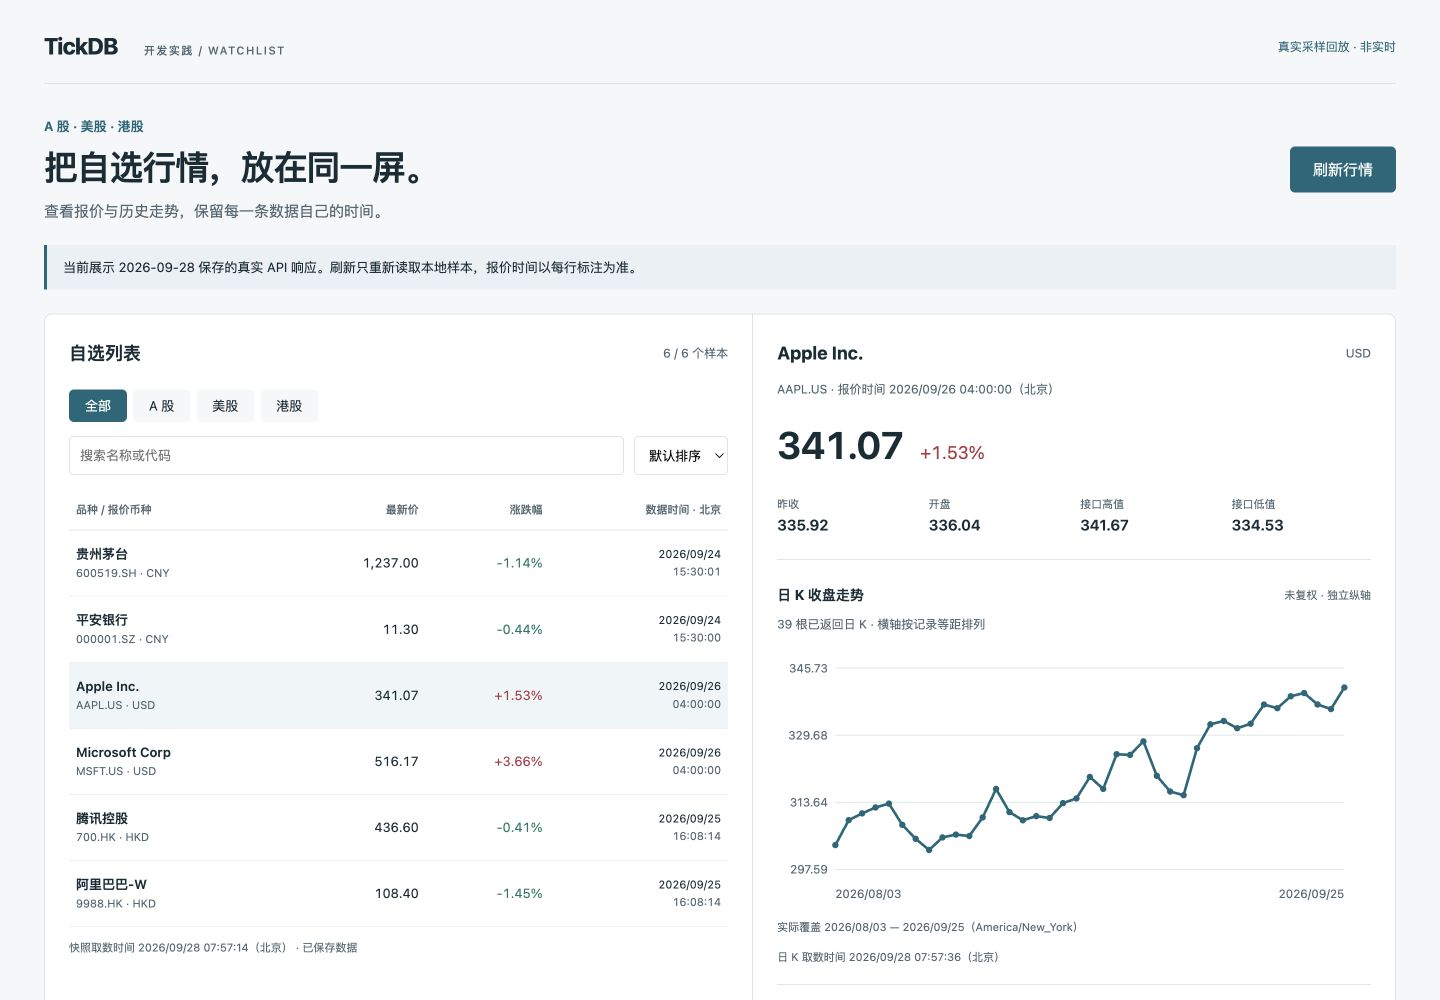
Figure 1: Actual screenshot of the local application. The six stocks are development samples, and quote timestamps are preserved per row; the chart on the right uses 39 historical daily K-lines returned by Apple, not a real-time push screen.
This dashboard has only two main areas.
The left watchlist answers "which stock do I want to view": switch between A-shares, US stocks, and Hong Kong stocks, type a name or code to narrow results, then sort by price change. The right detail panel answers "what does it return now, what does the history look like": latest price, price change percentage, previous close, open, plus a daily K-line closing price chart.
The samples are 600519.SH, 000001.SZ, AAPL.US, MSFT.US, 700.HK, 9988.HK—two from each market. The search only works within these six samples; it hasn't been packaged as a full-market securities search. Trading, profit calculation, or stock-picking signals have not been added either.
The value of doing it this way is establishing a complete data chain first: data retrieval, display, interaction, error messages, and timestamp annotation can all be verified on a small scale.
Two Endpoints—Clear Division of Labor
The list uses the market snapshot endpoint; historical K-lines are fetched after clicking for details. The mapping is as follows:
| Page Feature | TickDB Endpoint | How It's Used in This Example |
|---|---|---|
| Six-stock quote list | GET /v1/market/ticker | symbols comma-separated, one request for all six stocks |
| Single stock historical chart | GET /v1/market/kline | Single symbol, daily interval=1d, read close for charting |
The official market snapshot documentation specifies a maximum of 50 symbols per query, with timestamps in UTC milliseconds. This example only queries six stocks, so there's no need to send a separate request for each row. Market Snapshot Documentation
The historical K-line endpoint is for completed periods; K-lines still updating within the current period have a separate endpoint. This example shows the closing price trend of returned daily K-lines, so the latest price from the snapshot is not appended to the end of the historical chart. Historical K-Line Documentation
Once these two endpoints are separated, the page logic becomes straightforward: filtering and sorting are done locally in the browser; switching stocks requires fetching that stock's trend data.
Keep the API Key on the Server
The browser accesses /api/ticker and /api/kline provided by the local server. The local server then sends requests to TickDB with the authentication header, and returns the market data response to the page.
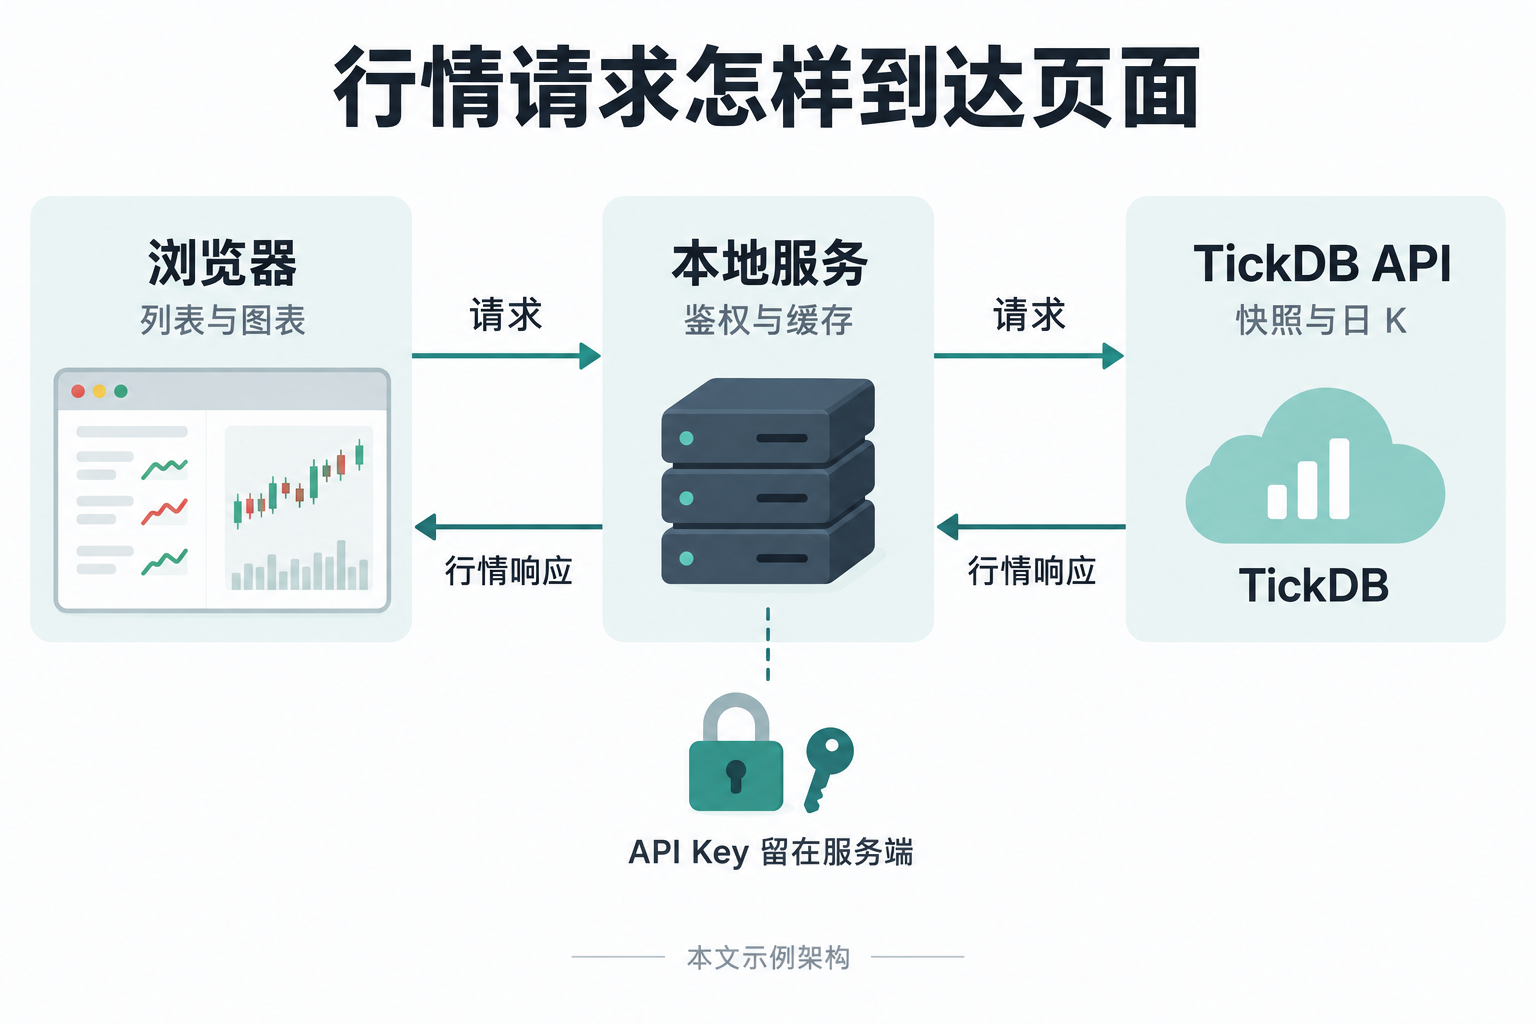
Figure 2: Request flow diagram for this example. The API Key is provided via server-side environment variables; the browser receives market data responses but not the key. This is the design of this example application, not TickDB's official internal architecture.
TickDB's REST quick start documentation uses the X-API-Key request header. Don't directly copy header names used in other access layers to REST requests. Quick Start
The core server-side request can be written like this:
import json
import os
from urllib.parse import urlencode
from urllib.request import Request, urlopen

params = {
    "symbols": "600519.SH,000001.SZ,AAPL.US,MSFT.US,700.HK,9988.HK",
    "type": "stock",
}
request = Request(
    "https://api.tickdb.ai/v1/market/ticker?" + urlencode(params),
    headers={"X-API-Key": os.environ["TICKDB_API_KEY"]},
)
with urlopen(request, timeout=15) as response:
    payload = json.load(response)
if payload.get("code") != 0:
    raise RuntimeError(f"TickDB error: {payload.get('code')}")
The complete example also handles HTTP errors, connection failures, and response structure errors. After the HTTP request completes, you must still check the business code—don't assume "refresh successful" just because JSON was received.
To avoid repeated upstream access from consecutive clicks, this example caches snapshots for 60 seconds and K-lines for 15 minutes in online mode. Both are caching strategies chosen by this example itself, not TickDB's official refresh rate or package commitment. The application doesn't auto-poll; when the user clicks refresh, if the cache hasn't expired, it continues using the original result and original fetch timestamp.
The server only accepts the six sample codes and doesn't allow browsers to pass arbitrary upstream URLs. This facilitates verification and prevents the example service from becoming an open proxy.
Process Data on the Frontend First, Then Colors
Some market data fields are numeric strings. Converting them directly to numbers is convenient, but Number(null) and Number("") both return 0. Without pre-checking, the interface might render "no data received" as "确实为零" (definitely zero).
This example uses a small conversion function:
const number = value => {
  if (value === null || value === undefined || String(value).trim() === "") {
    return null;
  }
  const result = Number(value);
  return Number.isFinite(result) ? result : null;
};
Missing values display as —; genuine zero values are preserved. The price change percentage uses the endpoint's price_change_percent_24h, with red for gains and green for losses, and includes positive/negative signs to avoid relying solely on color to convey meaning.
The official caching page describes this set of fields as "24-hour" changes, while the current market data tool distinguishes between traditional market trading days/sessions and the rolling 24-hour standard for crypto assets. The dashboard uses the neutral label "price change percentage," preserves the original field, and does not interpret three-market stocks as rolling 24-hour, nor does it manually convert to price change amount divided by latest price.
Quote currencies for the sample stocks are explicitly configured in the application as CNY, USD, and HKD, displayed alongside the codes. This is only the configuration for these six stocks, not a general rule for inferring all securities' currencies by exchange suffix. The three currencies' prices are not summed together, nor plotted on the same absolute price Y-axis.
Filtering, searching, and sorting do not overwrite the original market data. The detail panel retains the currently selected stock even if it's temporarily hidden by the list filter; the detail only switches when you click on a stock in the list again.
In Charts, Time Matters More Than Drawing One More Line
This example preserves three types of time on the page:
| Time | What It Tells the Reader | Display Method |
|---|---|---|
Snapshot timestamp | The data moment this quote corresponds to | Beijing time displayed per row |
| Server fetch time | When this request completed | Displayed separately, not overwriting quote time |
Daily K-line time | The moment this historical K-line corresponds to | Date labels generated per the stock's market timezone |
This is a distinction that's easy to see after actual operation. The six-stock snapshot collected on the morning of September 28 doesn't have all data points falling on September 28: this time the A-share samples are from September 24, US stock samples convert to Beijing time as September 26 at 04:00, and Hong Kong stock samples are from September 25 at 16:08:14.
These times come from the original response. They are sufficient to explain why the page shouldn't write "quote just updated" for "request just succeeded," but you cannot determine the cause of all differences from this data alone.
The charts are processed with the same principle: sort by time ascending first, then convert close to numbers. The X-axis is evenly spaced according to actual returned records, with the actual start/end dates and record count noted beside it; dates not returned are not automatically filled in by the page.
const points = klines
  .filter(k => number(k.time) !== null && number(k.close) !== null)
  .sort((a, b) => a.time - b.time);
For example, Tencent's snapshot latest price is 436.60 HKD, corresponding to September 25; the last daily K-line returned by the same round of historical requests is September 24, with a closing price of 438.40 HKD. The dashboard displays both facts simultaneously, it does not append 436.60 as a K-line that doesn't exist in the response.
This small detail is more meaningful than adding more indicators to the chart: users can see what the current page actually received.
How to Run and Validate
The complete local example includes four main files: server.py handles endpoints, authentication, and caching; index.html defines the page structure; app.js implements interaction and SVG charts; style.css handles desktop and narrow-screen layouts. The sampled responses from this run are also preserved for replay mode.
Using Python 3.10 or higher, run in the example's app directory:
python3 server.py
Open http://127.0.0.1:8765 to view the real sample replay. This mode doesn't require a key and won't make additional requests to TickDB—it's suitable for checking the page and reproducing screenshots.
To validate your own online data, set the TICKDB_API_KEY environment variable in the server terminal, then run:
python3 server.py --live --port 8766
Then open http://127.0.0.1:8766. When no key is present, online mode will refuse to start directly and won't silently fall back to sample data. Keys are obtained from the entry point guided by TickDB Official Quick Start; actual accessible markets and capabilities depend on your account rights.
This validation includes:
- Real Data Collection: 7 serial calls, 1 six-stock snapshot and 6 historical daily K-line requests, all returned
code=0. Historical request window is 2026-08-01 to 2026-09-27 UTC,limit=40,adjust=none, each returning 39 daily K-lines, totaling 234. Request parameters, UTC/Beijing times, and original responses are all preserved. - Page Interaction: Hong Kong stock filter yields two samples; searching
700finds Tencent; empty state displayed when no match; with this sample, Microsoft ranks first when sorted by price change descending; clicking a stock switches its detail and chart. - Server Logic: 6 automated tests cover replay data, authentication headers and caching, connection failures, HTTP errors, business errors, and K-line request ranges. Online branch tests use mock upstream and are not equivalent to real direct connection validation.
- Display Range: Checked on desktop and 390-pixel narrow screens. On narrow screens, the list and details are arranged vertically, with the table in its own horizontal scroll area.
REST online mode and replay samples use different historical windows: online mode fetches the most recent 70 days with limit=100; replay preserves this fixed sampling window. The interface always displays the actual returned range and doesn't guarantee that requesting a certain number of days will result in that exact number of K-lines.
When Extending Further, Decide What You Actually Need First
This version already serves as a starting point for a small market data application: the six-stock list is viewable, individual stock details can be switched, time sources are traceable, and endpoint failures have clear prompts.
If expanding to more symbols, the next step could be integrating an available symbols list, then designing user watchlist additions/deletions and persistence. If deploying publicly, you'll need to add user authentication, access limits, and account-specific data display permission verification. If implementing continuous updates, you'll need to separately implement and validate a push or polling mechanism—you can't claim the current manual refresh is already a completed real-time push.
Starting from this small dashboard, TickDB takes on the unified data retrieval entry point, while the application takes on data display, interaction, and state interpretation. First validating six-stock online requests with your own API Key, then deciding whether to add symbols and update methods, is an easy-to-verify and convenient-to-iterate entry point for integration.
Stocks in this article are used for software development examples only and do not constitute stock buying/selling advice.