Free Stock APIs: What to Check Before Moving From Research to an App
TickDB Research ·
Abstract: For product leads turning a research prototype into a market dashboard, choosing a free stock API takes more than getting a successful response. Using a 20-stock watchlist refreshed every ten seconds, this guide separates data access, request budgets, streaming limits and permitted use. It draws on official documentation for AKShare, Alpha Vantage, Twelve Data and TickDB, adds a recorded TickDB MCP query, and provides a practical decision worksheet and runnable Python quota calculator.
Suppose you are turning a personal research script into a dashboard that colleagues—or eventually customers—will use. The initial scope is modest: 20 US stocks, refreshed every ten seconds.
Getting the first price onto a page may be straightforward. The delivery questions are harder. Can the account access all 20 symbols? Will the quota last through the session? What happens when the trial expires? Does access for personal analysis also cover a customer-facing display?
Choose a free stock API by matching its conditions to a defined workload. Check the data, capacity, duration and intended use separately. A successful request is one item on that list, rather than approval for the entire application.
1. Work out what “free” actually covers
Search results mix open-source libraries, recurring free tiers and time-limited trials. These give you different starting points.
| Type of access | What you receive | What to check first |
|---|---|---|
| Open-source software | Code you can install, inspect or modify to obtain data | Upstream sources, intended uses and maintenance requirements |
| A recurring free allowance | A limited amount of service capacity under specified conditions | Per-minute, daily, per-symbol and endpoint-specific accounting |
| A time-limited trial | Access to selected capabilities or samples for a fixed period | Expiry, eligible symbols and the gap to your production requirements |
| Use-specific access | Permission to use data in a defined setting | Personal analysis, internal computation, internal display and external distribution |
These conditions often overlap. A recurring free tier may also restrict datasets and permitted uses.
The following examples come from official pages checked on November 9, 2026. The recorded API query appears separately later in the article.
| Option | A condition worth noticing | Implication for selection |
|---|---|---|
| AKShare | An open-source Python financial-data library whose project documentation describes an academic-research purpose and cautions about commercial risk | Assess source requirements and maintenance; the software's availability does not settle the rights to upstream data |
| Alpha Vantage | The standard free allowance is 25 requests per day, with separate arrangements for verified open-source or educational projects; real-time and 15-minute-delayed US stock data are premium offerings | Check dataset eligibility before sizing calls |
| Twelve Data | Basic lists 8 API credits per minute and 800 per day, with internal non-display usage | Check endpoint weights and usage terms as well as request counts |
| TickDB | The Free offering lists a seven-day trial, selected symbols, five concurrent subscriptions, one WebSocket connection and 30 API requests per minute | Check expiry, symbol access and each capacity limit independently |
Getting software for free, making a request for free and accessing the dataset you need for free are separate questions. Who will use the resulting data adds another condition.
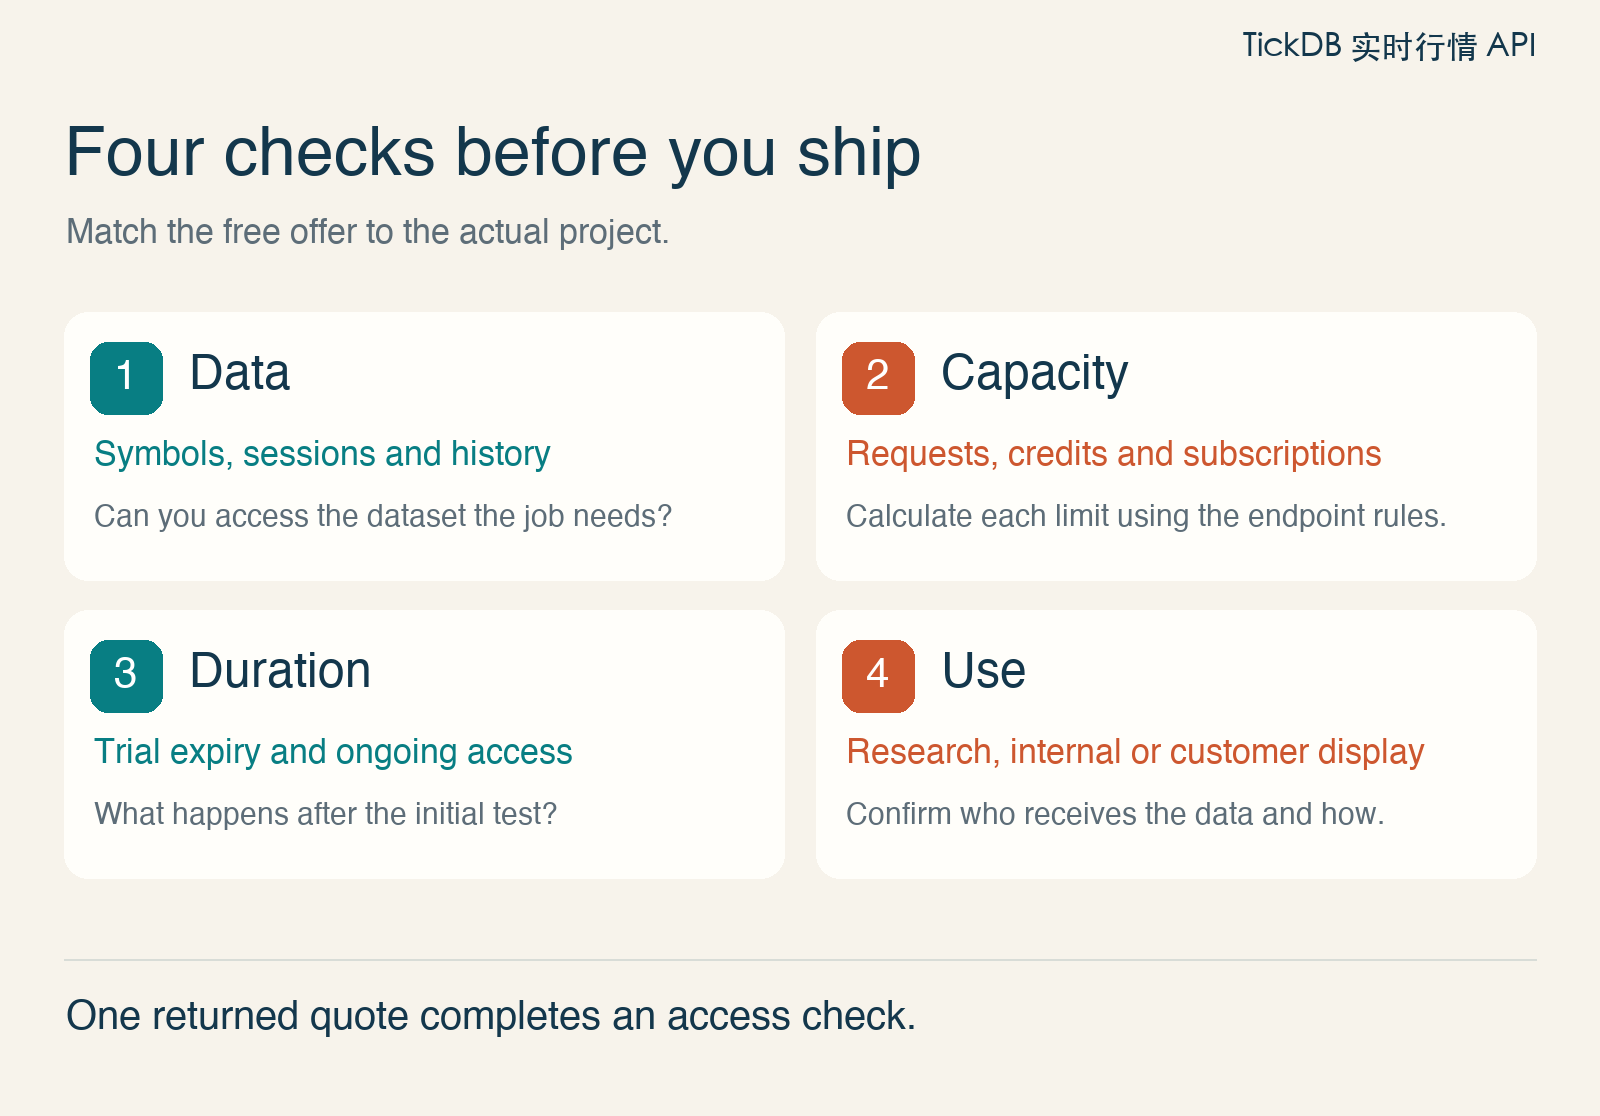
Figure 1. Evaluate each condition against the project. Passing one check does not resolve the others.
2. Turn the project into a measurable workload
“Stock market data” is too broad to size. For the proposed dashboard, write down:
- Universe: the actual list of 20 US symbols.
- Data: quotes for the intended session, with a defined timestamp and acceptable data age.
- Refresh: an application request every ten seconds; the source's update frequency must be checked separately.
- Runtime: a one-hour initial test, followed by a new calculation for the full daily workload.
- Audience: personal testing first; internal or customer use needs its own review.
- Failure behavior: stale data is visibly marked when updates stop.
A ten-second page refresh is an application behavior. It cannot turn an end-of-day dataset into intraday quotes. Streaming changes how updates arrive, while coverage and usage conditions still apply.
Count requests, credits and subscriptions separately
For an illustrative calculation, assume one request can fetch all 20 symbols and each symbol costs one credit per polling round. Poll at seconds 0, 10, 20 and so on, stopping before second 3,600: 360 rounds. Exclude startup calls, retries and other endpoints for now.
| Measure | Calculation | Requirement |
|---|---|---|
| HTTP requests per minute | 6 rounds × 1 request | 6 |
| Credits per minute | 6 rounds × 20 symbols × 1 credit | 120 |
| HTTP requests in one hour | 6 × 60 | 360 |
| Credits in one hour | 120 × 60 | 7,200 |
Batching reduces HTTP requests; it may leave per-symbol credit consumption unchanged. Twelve Data's official examples calculate credits using endpoint weights and symbol counts. Check the endpoint you intend to use rather than applying this illustrative model to every provider.
For a streaming alternative, assume one subscription unit per symbol for the selected channel. The watchlist then needs 20 concurrent units. A WebSocket connection and the subscriptions carried over it are different limits.
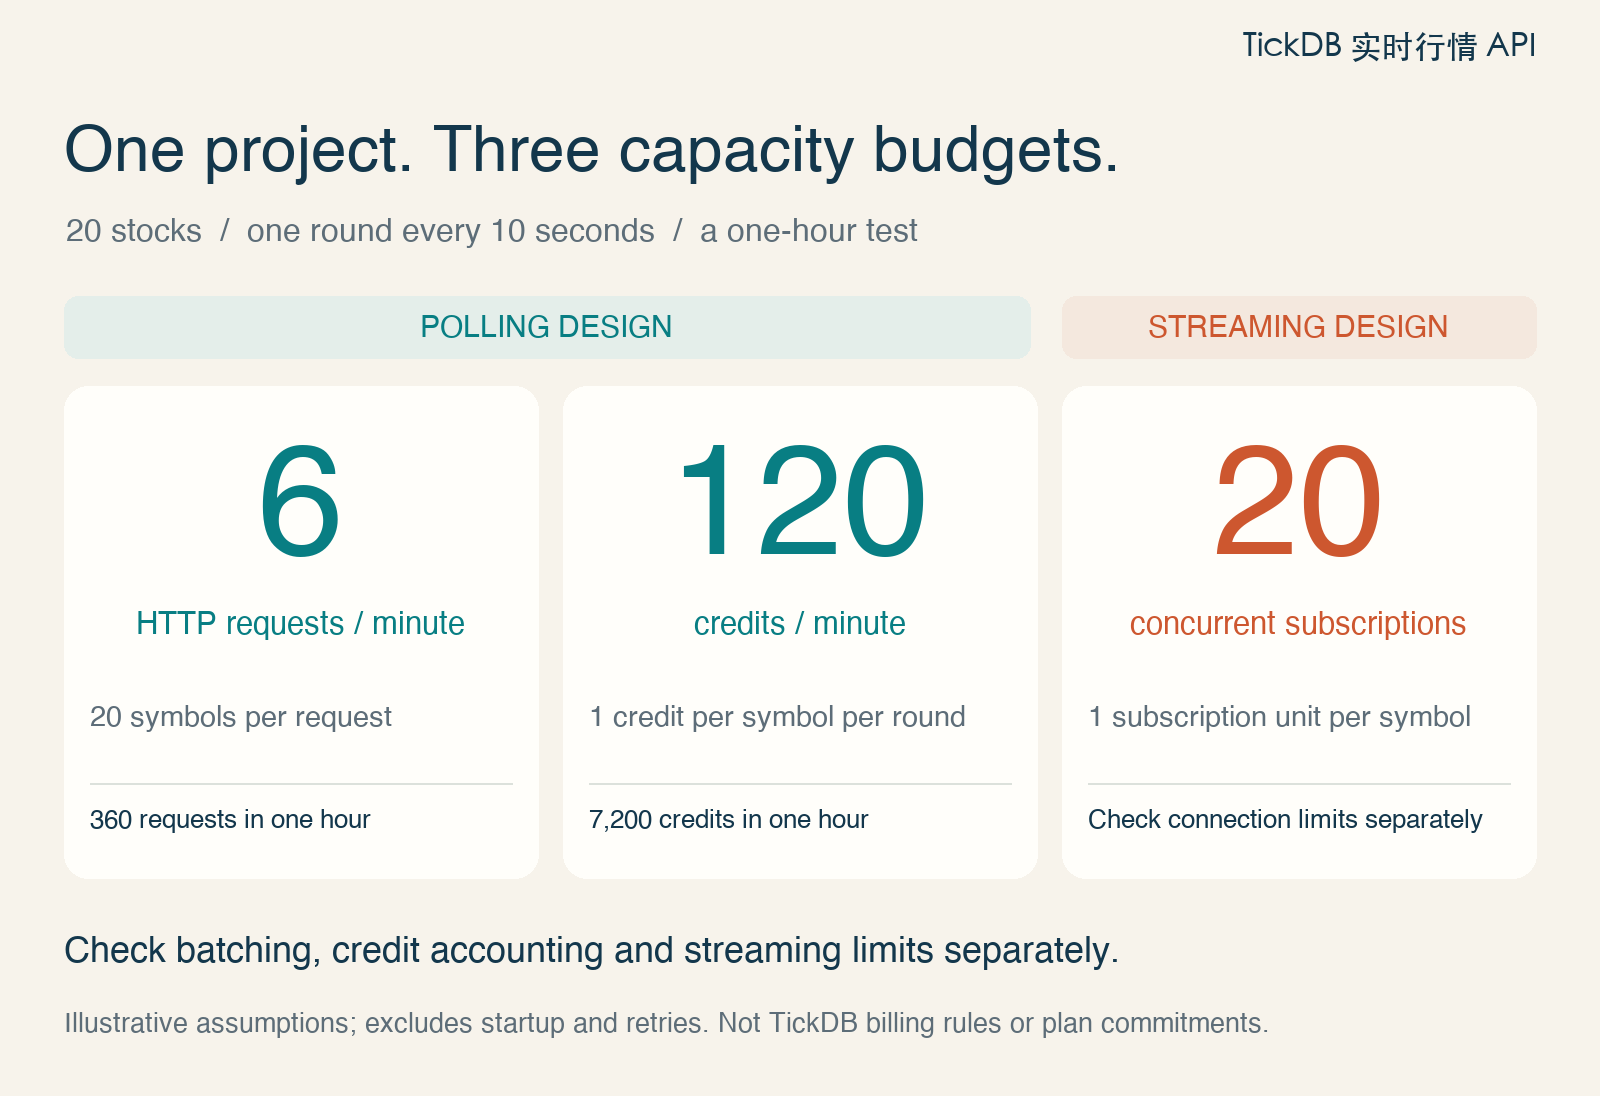
Figure 2. Polling and streaming are alternative designs. These assumptions illustrate capacity accounting; they are not TickDB billing rules or plan commitments.
A runnable Python budget calculator
Save this as budget.py and run python3 budget.py with Python 3.10 or later. It uses the standard library, requires no API key and makes no network requests. Replace the inputs with the target endpoint's actual rules.
from math import ceil
import json

symbols = 20
interval_seconds = 10
duration_minutes = 60
symbols_per_request = 20
credits_per_symbol = 1
channels_per_symbol = 1

polls_per_minute = 60 / interval_seconds
requests_per_poll = ceil(symbols / symbols_per_request)
result = {
    "requests_per_minute": polls_per_minute * requests_per_poll,
    "requests_in_test": polls_per_minute * requests_per_poll * duration_minutes,
    "credits_per_minute": polls_per_minute * symbols * credits_per_symbol,
    "credits_in_test": polls_per_minute * symbols * credits_per_symbol * duration_minutes,
    "concurrent_subscriptions_if_streaming": symbols * channels_per_symbol,
}
print(json.dumps(result, indent=2))
The recorded local run produced six requests and 120 credits per minute, totaling 360 requests and 7,200 credits for the hour. The alternative streaming assumption requires 20 concurrent subscriptions.
This is a planning estimate for fixed inputs. Budget historical backfills, startup and retries separately. A dashboard and a history downloader may draw from the same account allowance even if they run as separate processes.
3. Check whether the data fits the job
Historical research and a live dashboard have different acceptance criteria.
For research, inspect date coverage, bar interval, adjustment method and the security universe. A free endpoint returning the latest 100 rows will not satisfy a multi-year study. A current-symbol list also needs review before it becomes a historical universe.
For a dashboard, inspect symbol access, the required trading session and the data timestamp. Keep two clocks:
- Data time: the timestamp associated with the returned market record.
- Receipt time: when your application received the response.
A response received now can contain an earlier main-session quote. Pre-market, post-market and other session quotes may appear in separate objects. Decide which one the interface displays. Assess staleness against the required session and market status rather than treating every ten-second gap during a closure as a fault.
Test the actual symbol list, required fields and date ranges. Finding a security in a product directory establishes its identity; access to its data under your account still needs a query.
4. Recheck use conditions when the audience changes
Sharing a dashboard does not necessarily multiply upstream requests. A backend may fetch and cache data once for several viewers. Actual request growth depends on the implementation.
The audience and use, however, have changed. Separate personal analysis, internal computation, internal display, customer display and onward data delivery in the requirements. A tier labeled internal non-display, such as Twelve Data Basic, should not simply be assumed to cover a customer quote screen.
Replace “Can we use this commercially?” with a precise description:
Which markets and fields will we use? Who sees them? Is access sold to customers? Can users export records? Will we provide raw data to another party? How long will we retain it?
Ask the provider to confirm those uses and keep the applicable terms or written response. An installed library, a paid key or one successful quote does not complete that review.
A worksheet for the handoff
This is a planning example for the proposed dashboard, with open items left visible. It is not an acceptance report for a deployed product.
| Check | Project requirement | Current evidence | Next action |
|---|---|---|---|
| Universe | 20 specified US stocks | One AAPL sample checked | Verify the full list with the intended account |
| Data and session | Main-session quotes with visible data time | One main-quote timestamp recorded | Check updates during the target session |
| Polling capacity | Ten-second rounds for a one-hour test | 360 HTTP requests under the 20-symbol batch assumption | Confirm batching and actual quota accounting |
| Streaming capacity | Subscriptions for the chosen channels, if streaming is selected | No WebSocket run completed | Check channel rules and concurrent limits |
| Duration | Continue after the initial test | Account expiry still to be recorded | Document what happens when access expires |
| Intended use | Personal test, then internal or customer dashboard | External display conditions unresolved | Submit the precise use case and retain the answer |
| Operational behavior | Updates during the target session, with stale-data handling | No continuous test completed | Log successes, failures, gaps and recovery |
You can start a prototype before every row is complete. Keep it within the testing uses already permitted. An unresolved customer-display condition remains a delivery dependency; one accessible symbol remains one sample.
5. A small TickDB access check
TickDB provides data-access paths for research prototypes and market applications. Its stock page describes REST queries and WebSocket streaming across US, Hong Kong and China A-share markets. For this check, an already-connected MCP integration was used to identify a security and retrieve one quote.
Reproduce the sequence
- Connect TickDB in a supported MCP client using its current setup instructions and your own key. Keep credentials in local configuration, outside the prompt.
- Call
get_available_symbolswithmarket="US",type="stock",limit=1000andoffset=0. The returned page containedAAPL, identified as Apple Inc. in the US market. - Call
get_tickerwithsymbols="AAPL.US"andtype="stock", following the quote tool's symbol format. The directory and quote used different representations in this run; check market identity and the tool contract. - Save the complete response. Extract the symbol, data timestamp and presence of the price field; record receipt time separately.
With MCP already connected, a suitable instruction is:
Use the connected TickDB MCP to confirm Apple in the US stock directory,
then query the AAPL.US stock quote. Save the complete original JSON.
Report symbol, timestamp and whether last_price has a value;
record the retrieval time separately. Keep any permission error.
Do not describe this one query as a continuous test.
The November 9, 2026 query returned this extracted summary. The market price itself is omitted.
entry: TickDB MCP / get_ticker
API code: 0
symbol: AAPL.US
timestamp_ms: 1793998800000
main_quote_time_utc: 2026-11-06T21:00:00Z
retrieved_at_utc: 2026-11-09T04:39:46Z
has_last_price: true
The response also included extended-session quote objects. The timestamp above belongs to the main quote only. An application displaying another session should handle that session's fields explicitly, without replacing data time with retrieval time.
A separate Python REST attempt in the same research run received HTTP 403, Cloudflare error 1010, and did not pass. Both outcomes were retained. The account tier used for the MCP query was not verified, so this result does not establish access for a free account.
The TickDB stock API page provides a starting point for checking current capabilities, access paths and conditions. This sample checks identity and a returned quote; the full watchlist, continuous updates and intended display use remain separate worksheet items.
Decide which stage the free option can support
For personal historical research, a free tool may be sufficient when coverage, data definitions and use conditions fit the study.
For validating fields and interface behavior, a limited allowance or trial can support a prototype. Record its expiry and unresolved requirements so another person can take over the work.
For ongoing team or customer use, repeat the assessment against the real runtime, complete universe and intended audience. Remaining request allowance is only one input. Dataset access, subscription capacity, duration and permitted use can each change the choice.
Fill in the symbol count, refresh interval, daily runtime and audience first. Then resolve the open condition most likely to block delivery. That gives your free stock API a defined job—and a clear boundary for when the choice needs revisiting.
Sources and sample query checked November 9, 2026. Service conditions can change; confirm the current official rules and account access before use.