Building a Multi-Market Stock Dashboard: 7 Things That Break After the Demo
TickDB Research ·
Wiring a market data API into a dashboard takes three days. The rework that follows launch almost always comes from numbers on the screen that can't say what they are. In one test, a China A-share's turnover came out 100× too small because of a single unit. Here are seven places a US, Hong Kong and China A-share dashboard breaks, each with a live test, plus seven questions to send your data vendor.
What you get, based on primary documents from the Shanghai Stock Exchange and HKEX, plus my own tests on seven asset classes during Asian trading hours on October 12, 2026:
- A "price ID" with five fields that every number on a market data screen should carry
- Seven rework points, one by one: where the money goes wrong, and why
- Seven questions you can paste into your next vendor email
- Two runnable Python snippets
The cheapest part of a dashboard is the API call
On Monday morning, October 12, I put Cambricon (688256.SH, a China A-share on Shanghai's STAR Market) and Tencent (700.HK) side by side and computed turnover myself as volume × price:
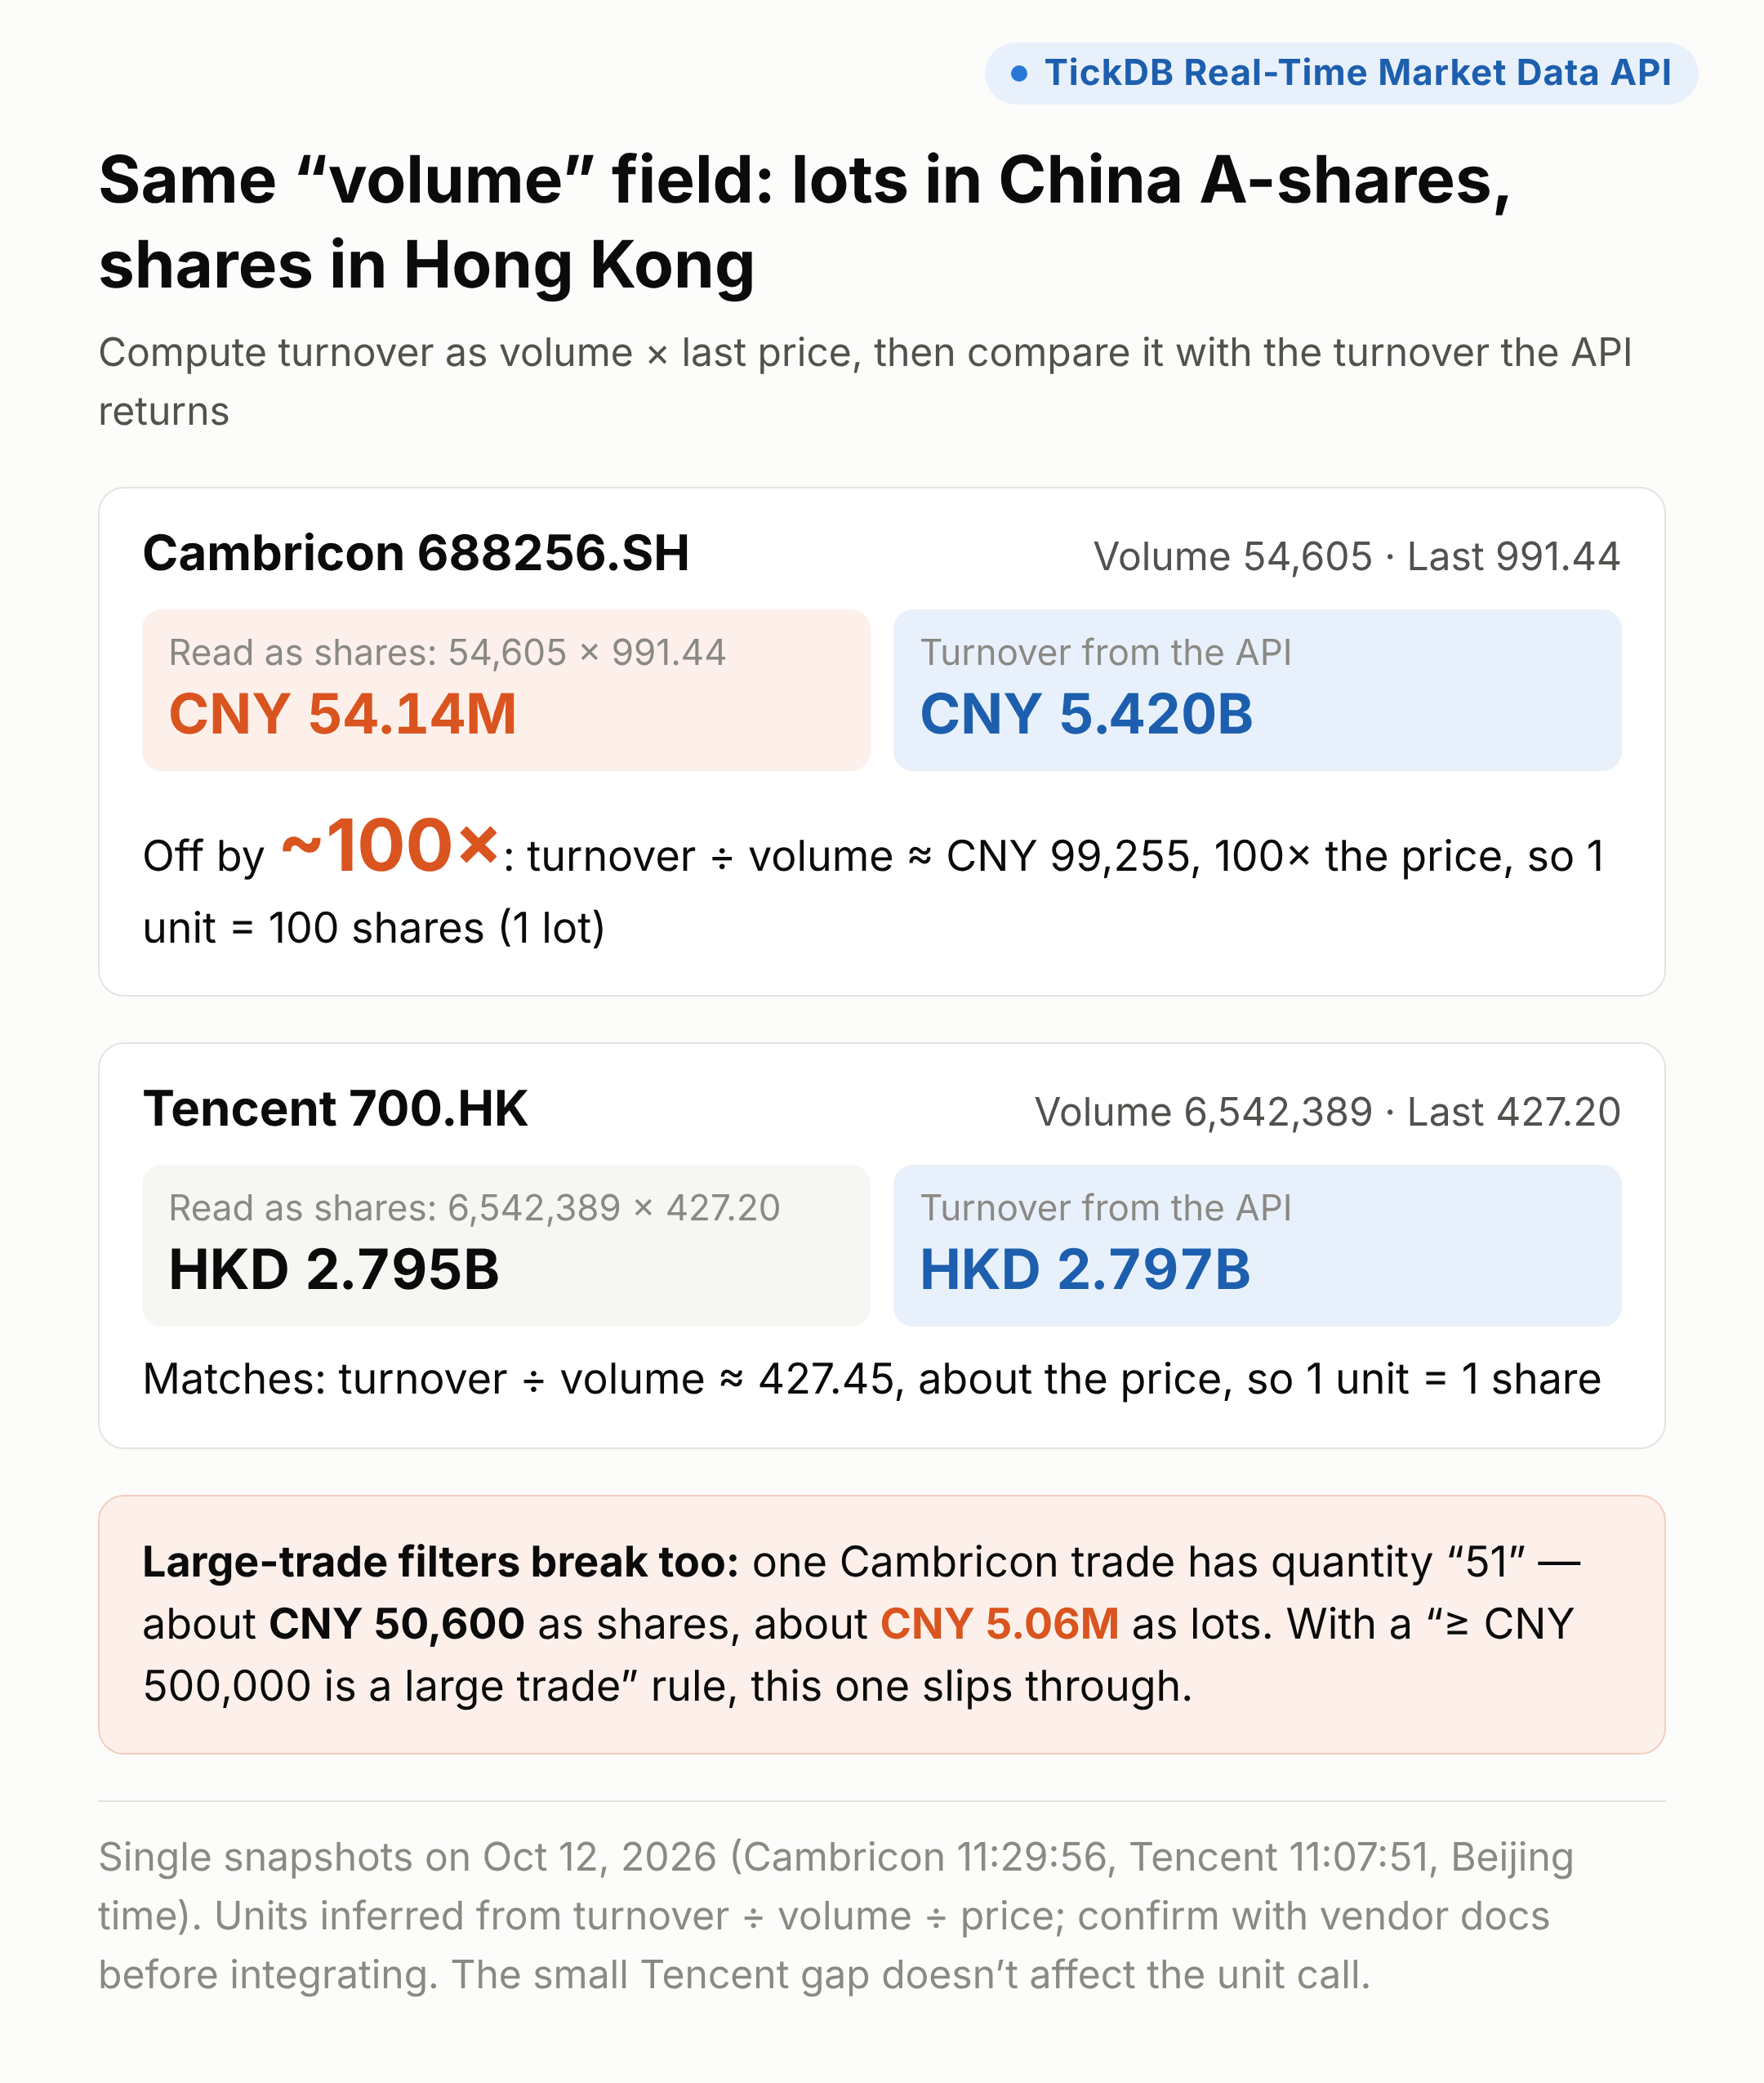
- Cambricon: volume 54,605, last price CNY 991.44. My turnover: about CNY 54.14 million. The API's turnover: about CNY 5.42 billion. Off by 100 times.
- Tencent: volume 6,542,389, last price HKD 427.20. My turnover: about HKD 2.795 billion. The API's: HKD 2.797 billion. A match.
Neither number is wrong. Cambricon's "volume" counts lots of 100 shares; Tencent's counts shares. Same field name, units 100 times apart.
Snapshots at 11:29:56 (Cambricon) and 11:07:51 (Tencent), Beijing time (UTC+8), October 12, 2026.
Units are only the start. Rules like this keep moving. Since July 6, every China A-share has had an extra 15:05–15:30 after-hours fixed-price session; according to the Securities Herald, about 1,900 main-board companies took part on day one. From November 16, Hong Kong begins standardizing board-lot sizes, and about 650 companies may have to change.
A market data API takes a few lines of code to connect. Whether a market data app can launch depends on whether every number on screen can show its price ID: instrument, session, method, time and status. Numbers that can't will come back as customer complaints, bad decisions or rework bills.
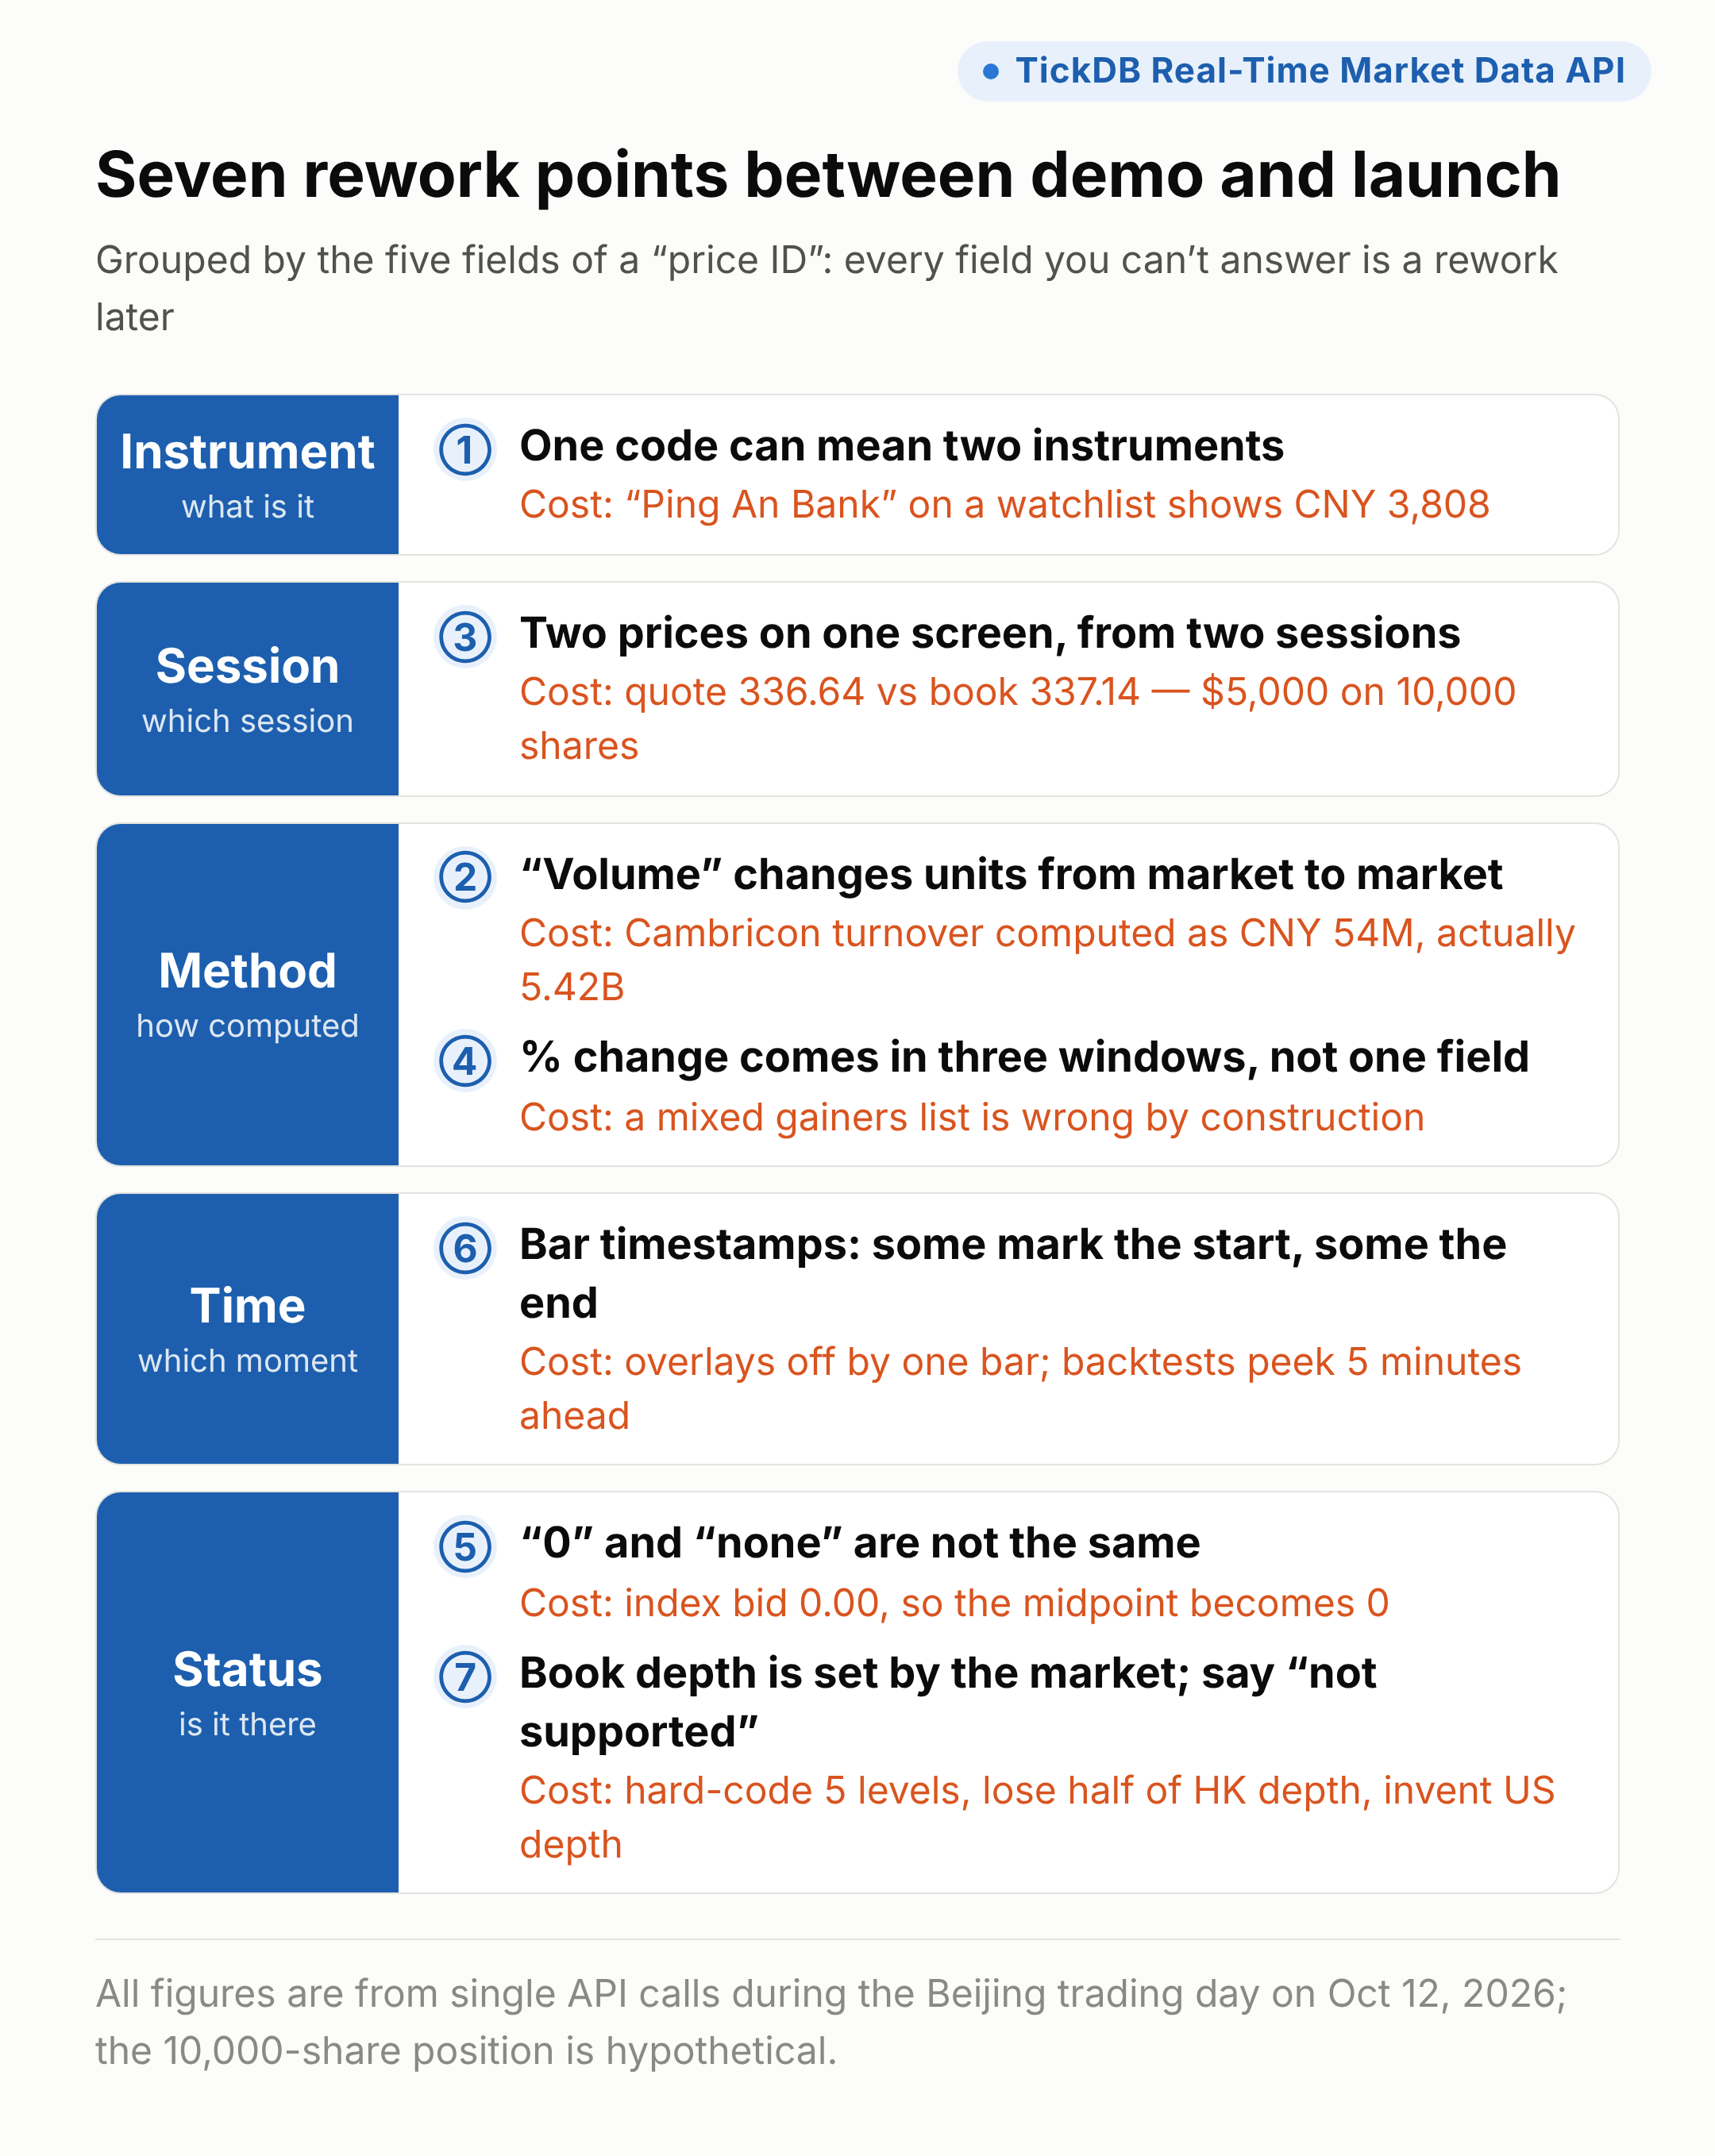
The rest of this piece runs in three parts: one panel, seven rework points, then build versus buy. If you don't write code, read each section up to "Ask your vendor" and forward the technical notes to your engineers.
Part 1 — A panel you can build in three days still owes five answers per number
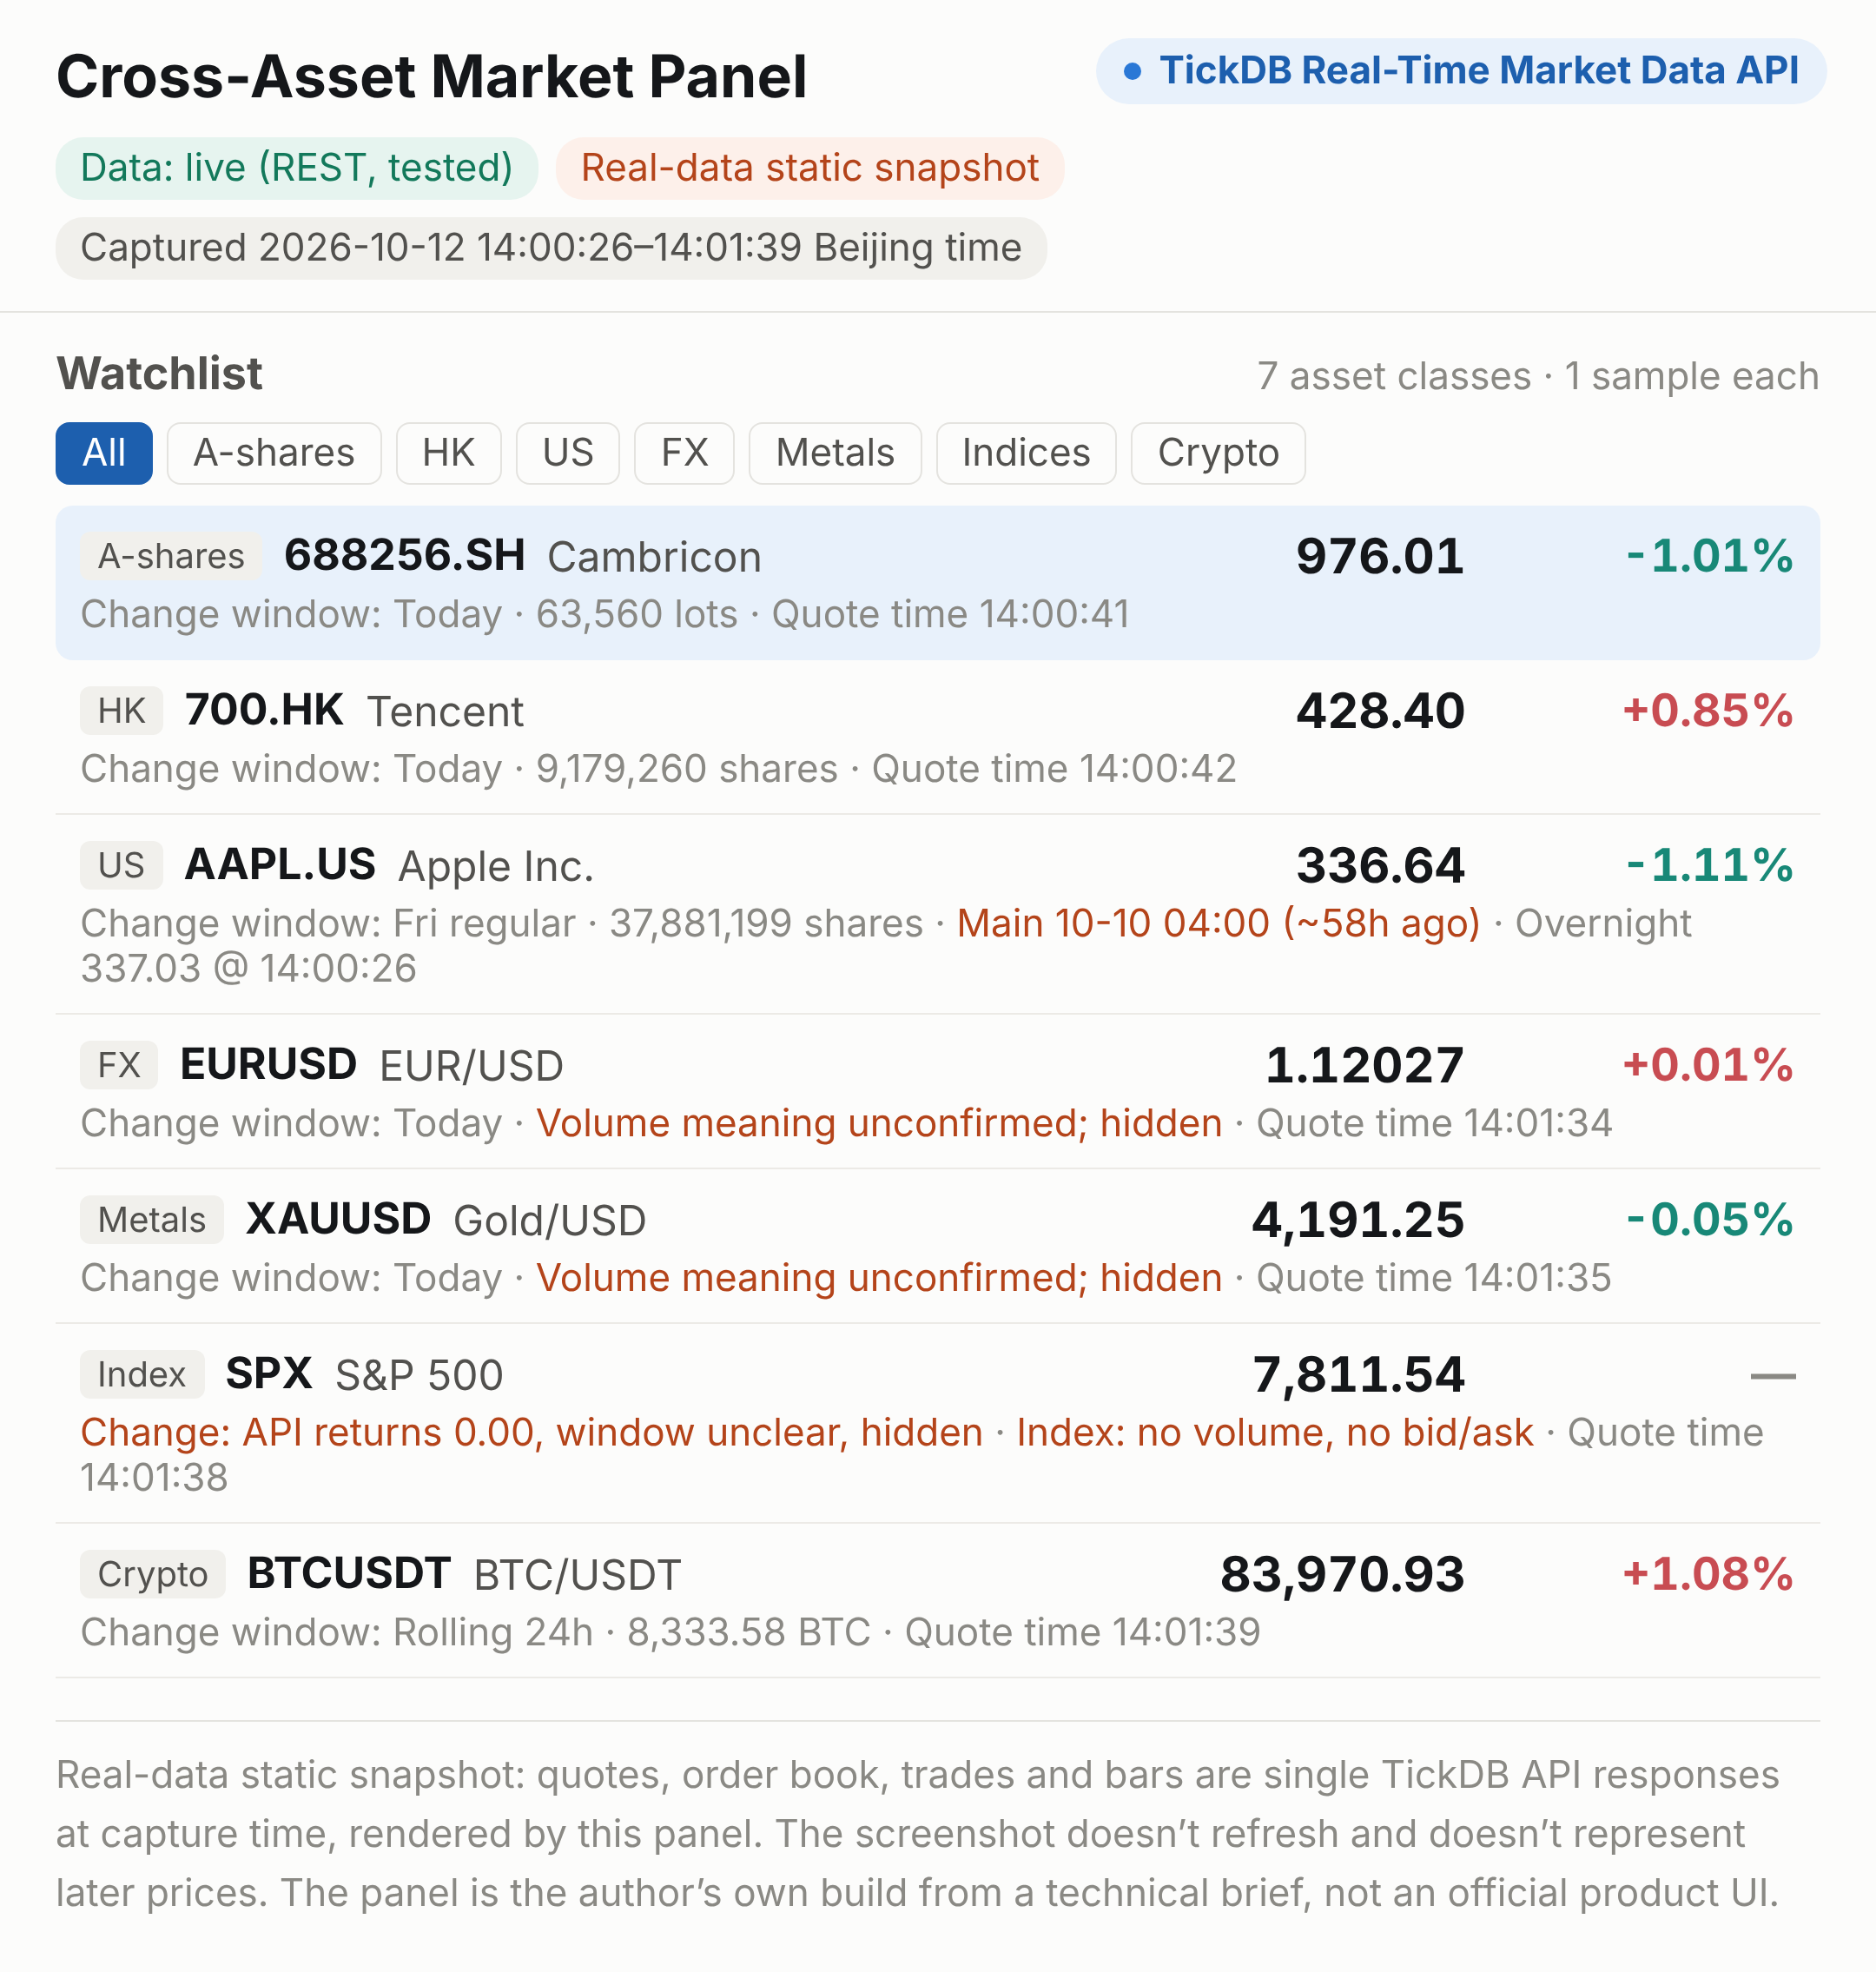
I built a cross-asset panel from a technical brief: a React front end, a Python back end, and the API key kept on the server. One instrument per asset class: Cambricon (China A-shares), Tencent (Hong Kong), Apple (US), EUR/USD (FX), gold (precious metals), the S&P 500 (index) and BTC/USDT (crypto).
Getting from the first API call to numbers on the page took less time than writing this paragraph.
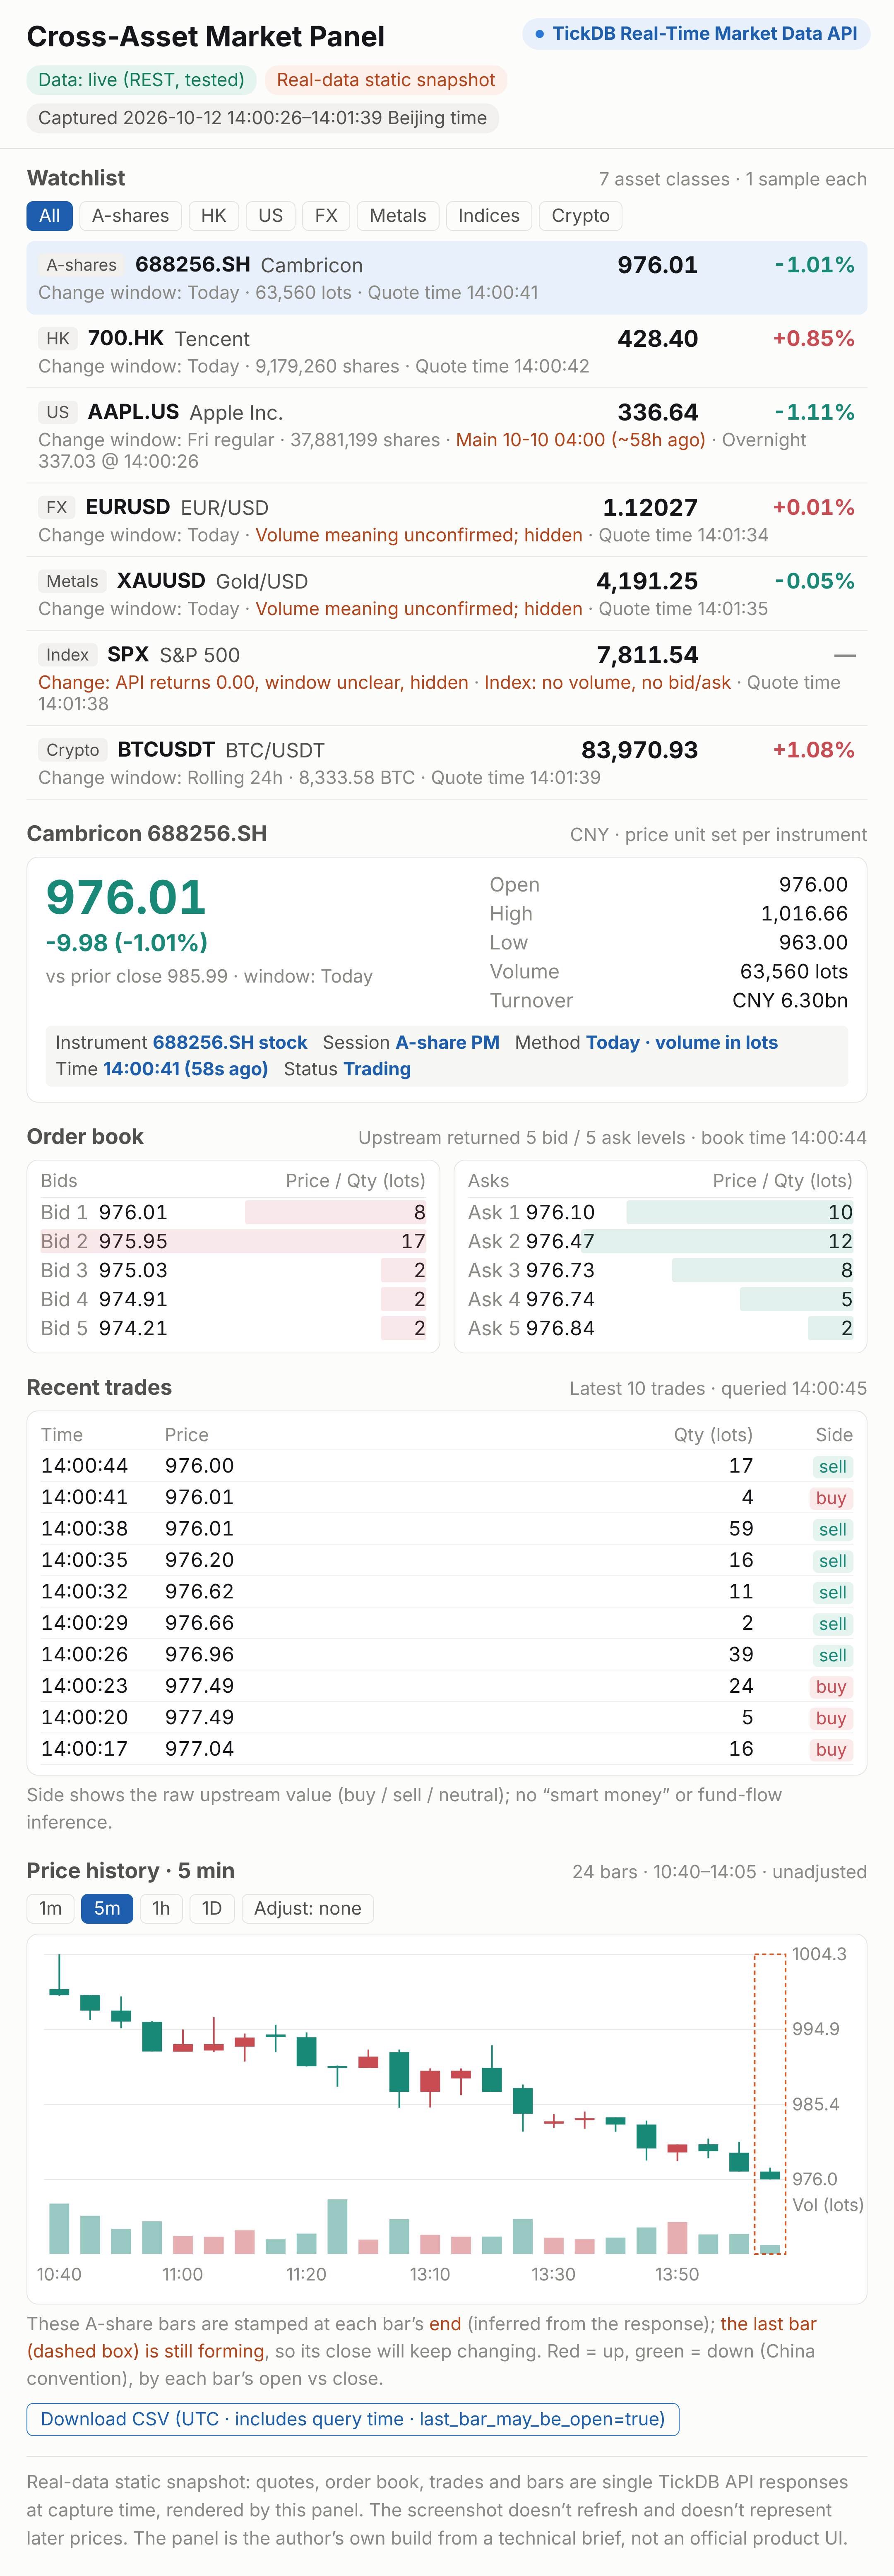
Real-data static snapshot, capture time shown in the image. The panel is my own build from the brief, not an official product UI.
Connecting fast isn't the same as being done. What this panel has that a three-day demo doesn't is the small print next to each number: which window the change uses, whether volume is in lots or shares, and what time the price is from.
That small print is the price ID:
| Field | What it answers | Example from the panel |
|---|---|---|
| Instrument | What is this number about | Is 000001 Ping An Bank or the Shanghai Composite |
| Session | Which trading session produced it | Apple's quote is Friday's close; its order book is today's overnight session |
| Method | Which rule and unit | % change for today or the rolling 24 hours; volume in lots or shares |
| Time | Which moment it belongs to | Does a bar's timestamp mark its start or its end |
| Status | Does it exist, and will it still change | An index "bid of 0" actually means none; the last bar is still moving |
Each field is a question to answer before launch; the one you can't answer is where a future ticket will land. All examples from my tests on October 12, 2026.
A demo answers "can it display?" A product has to answer what exactly is displayed.
Part 2 — Seven rework points: where the money goes wrong
All tests below are single calls made on October 12, 2026, Beijing time.
1. Instrument: one code can mean two instruments
An API that throws an error is safer than one that guesses for you.
The scenario: a user types "000001" into a watchlist. Do they want Ping An Bank or the Shanghai Composite Index?
What I found: querying "000001" without an asset type, the API returned HTTP 400 AMBIGUOUS_SYMBOL and listed both candidates. With a suffix, 000001.SZ is Ping An Bank at CNY 11.77 and 000001.SH is the Shanghai Composite at 3,808.54 points.
How the money goes wrong: if a system guessed "index," the watchlist row labeled Ping An Bank would show CNY 3,808. A 10,000-share position would be valued at about CNY 38 million instead of about CNY 118,000.
Why: the same digits can repeat across the Shanghai and Shenzhen exchanges, and between stocks and indices. Three things also get confused: the asset type in the request, the category on the page and the unit of the number. Gold is requested as forex, belongs under precious metals on screen and is priced in USD per ounce; an index is quoted in points and should never carry a currency sign.
Ask your vendor: when codes collide, do you return an error, pick a default, or silently return one of them?
For your engineers: build the instrument catalog from the product-listing endpoint with pagination, storing code, type, market and currency. Don't infer currency from the suffix, and have the back end accept only codes in the catalog.
2. Method: the unit of "volume" changes by market
Same field name doesn't mean same unit. Adding a market starts with checking units.
The scenario: a Hong Kong dashboard launches smoothly. The boss says "add A-shares." It's wired in half a day, and turnover, turnover rate and large-trade filters are all wrong.
What I found: dividing turnover by volume in the opening example gives about CNY 99,255 for Cambricon, 100 times the share price, so one unit is 100 shares; Tencent gives about 427.45, roughly the price, so one unit is one share. Order book and trade quantities follow the same rule: Cambricon's best bid at 14:00 was CNY 976.01 for 8 lots. (Units inferred from the responses; confirm with vendor docs.)
How the money goes wrong: a 100× turnover error is only the first layer. The second is large-trade filtering. One recent Cambricon trade had quantity "51": about CNY 50,600 read as shares, about CNY 5.06 million read as lots. With a "≥ CNY 500,000 is a large trade" threshold, that trade slips through.
Why: China A-share data conventionally reports volume in lots, Hong Kong in shares and crypto in coins; FX isn't traded on a central exchange, so its "volume" means something else again.
The unit table also isn't something you write once. HKEX currently has 44 board-lot sizes, from 10 to 100,000 shares; on June 30 it announced they will be cut to 8, with phase two starting November 16 and about 650 companies possibly affected. In China, STAR Market orders above 200 shares can increase in steps of one share, so "one lot = 100 shares" isn't always tidy in the trading rules either.
Ask your vendor: what are the units for volume, order book quantity and trade quantity in each market, and where is that documented?
For your engineers: configure units per market; never guess from the field name. Run a daily check of turnover ÷ volume ÷ price: a ratio near 1 or 100 is normal, and a sudden jump should alert. Code in Part 3.
3. Session: two prices on one screen may come from two sessions
The quote area and the order book each have their own session. Unlabeled, users just think your prices disagree.
The scenario: Monday morning in Asia, a user opens Apple's detail page. The quote says 336.64; the best bid is 337.14. They screenshot it to support: "Which one is real?"
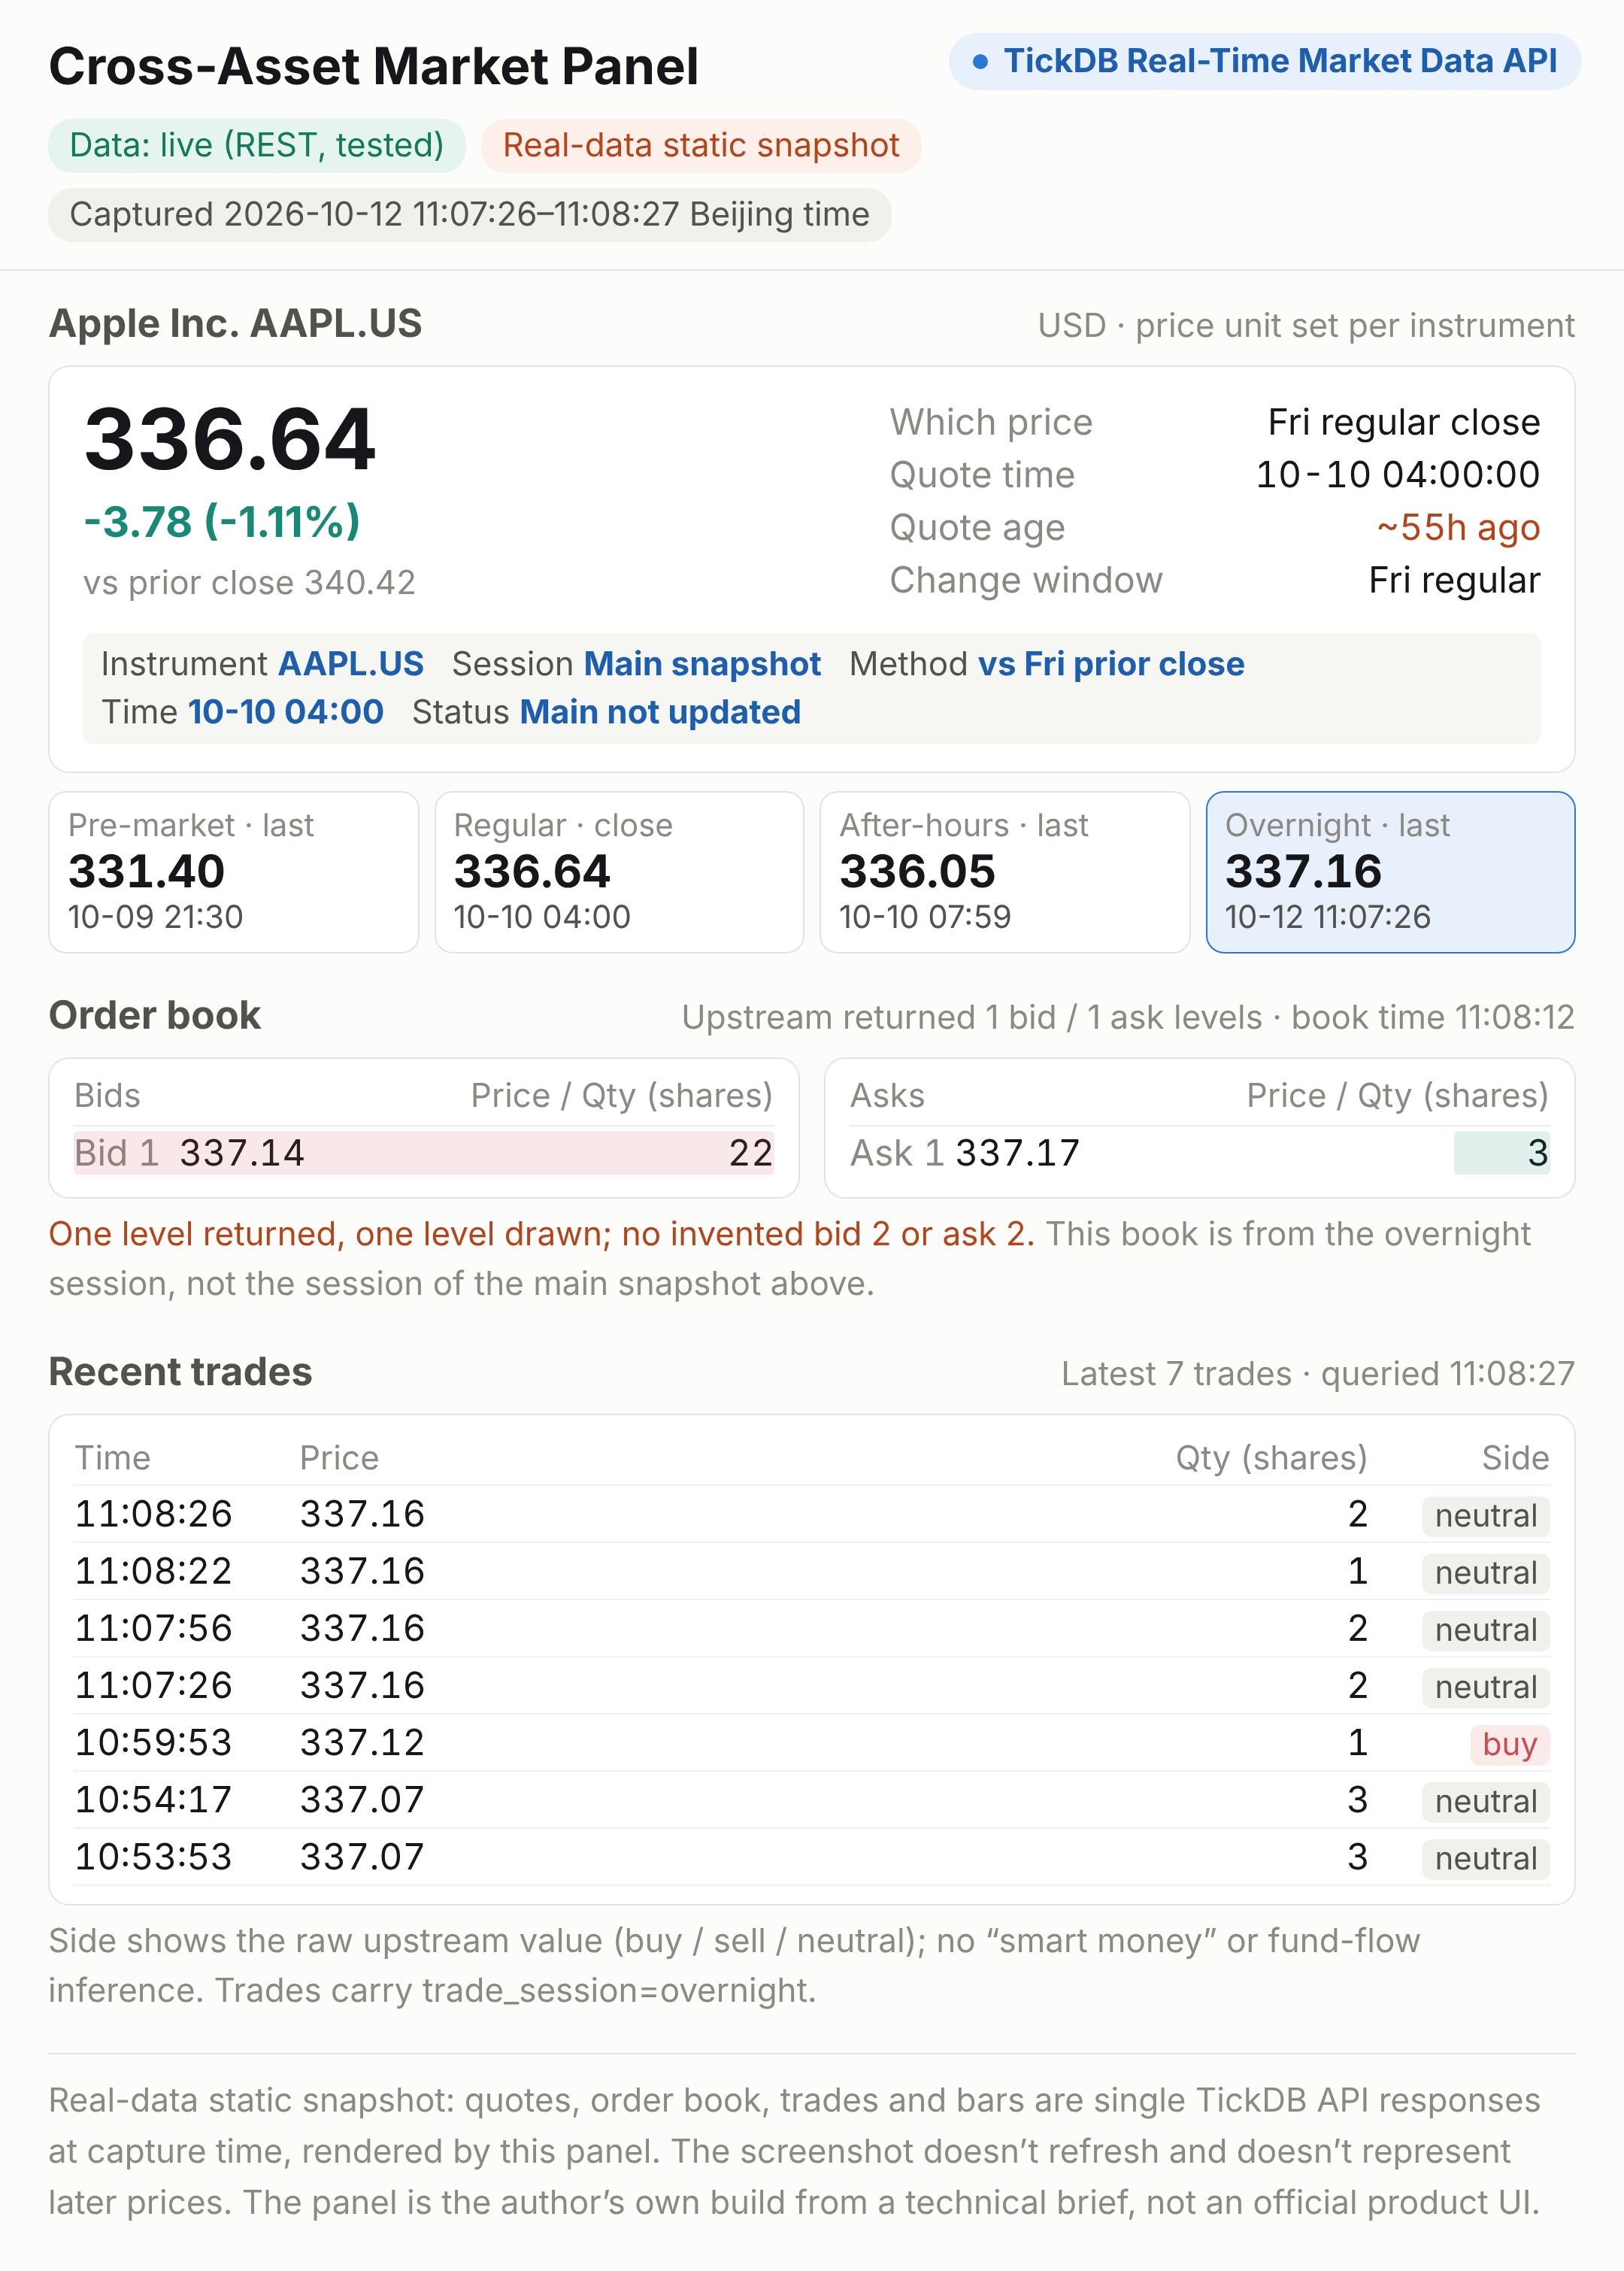
What I found: at 11:08 Beijing time, within the same minute:
- The 336.64 in the quote area was Friday's regular-session close, timestamped 04:00 Beijing time on October 10, about 55 hours earlier
- The same snapshot also carried an overnight price of 337.16, timestamped 11:07
- The order book showed a best bid of 337.14 and best ask of 337.17, one level each, from the overnight session in progress
- Every recent trade was tagged
overnight
At 2 p.m. the quote area still said 336.64, while the overnight price had moved to 337.03. That main snapshot won't move until the US regular session opens.
How the money goes wrong: P&L at the quote and orders at the book are $0.50 apart, which is $5,000 on 10,000 shares. The more common cost is support time: both numbers are right, but nobody told the user which session each belongs to.
Why: the snapshot's main price stays on the last regular session, and extended-hours prices live in separate objects, each with its own time. Order book and trades come from other endpoints and reflect whichever session is trading now.
China A-shares no longer simply "close at 15:00" either. Under the Shanghai Stock Exchange's revised Trading Rules, effective July 6, after-hours fixed-price trading expanded from the STAR Market to all A-shares and ETFs: 15:05 to 15:30 every day, at that day's closing price. According to the Securities Herald, about CNY 1.07 billion traded in that window on day one. Yet the trading-sessions endpoint I tested lists A-share hours only up to 14:57, leaving out both the closing auction and this after-hours window.
Check your session table yourself — don't rely only on the list an API gives you.
Ask your vendor: which session does each of snapshot, order book and trades reflect? Is A-share after-hours trading after 15:05 included in daily volume?
For your engineers: store market state by type + symbol + session; never let overnight data overwrite the main snapshot. Each area of the page shows its own session and time.
4. Method: % change isn't one field, it's three windows
Rank % changes with different windows in one list, and the ranking itself is wrong.
The scenario: the product team wants a "top gainers" list on the home screen, mixing stocks, FX and crypto.
What I found:
- Cambricon −1.01%: against a prior close of CNY 985.99, which didn't change all day
- Bitcoin +1.08%: at 2 p.m. its "prior close" was 83,074.01; at 11 a.m. the same field was 83,049.15. The prior close moved within the same day
- S&P 500 0.00%: prior close 7,811.54, identical to the last price. US markets hadn't opened, so 0.00 doesn't mean "flat today"
How the money goes wrong: comparing Bitcoin's 24-hour move with an A-share's daily move is meaningless, and alerts triggered on % change either fire wrongly or stay silent when they should fire.
Why: crypto trades around the clock with no close, so % change uses a rolling 24-hour window whose start moves every minute. Binance's official API docs say it plainly: its 24-hour ticker is a "24 hour rolling window" statistic. Stocks use the trading day; how an index's prior close rolls while the market is shut varies by provider.
Ask your vendor: for each asset class, what is the baseline and the window for % change? How does the prior close change when the market is closed?
For your engineers: tag every % change with its window and don't mix windows in one ranking; if you need one window, recompute from bars. The next article in this series covers this field in depth.
5. Status: "0" and "none" are different numbers
A field that doesn't apply should show "—", not "0".
The scenario: the S&P 500 row shows "bid 0.00, ask 0.00, volume 0." A user asks: "Nobody traded the S&P today?"
What I found: the API I tested returned 0.00000 for the S&P 500's bid and ask and 0.00 for volume, in both the morning and afternoon calls. An index has no order book and no volume; here 0 means "none."
FX and gold are a different case: they have bid and ask prices and also return a "volume" (EUR/USD 38,426.00, gold 45,598.00). FX isn't traded on a central exchange and the docs don't say what this number represents, so my panel doesn't show it.
How the money goes wrong: a midpoint of (0 + 0) ÷ 2 is 0, so the index valuation drops to zero; a liquidity control built on the bid/ask spread sees a spread of 0 and either alerts every day or never does. Neither error shows up in a test environment.
Why: an index is a calculated number that can't be traded, so it has no bids or asks. In the API, though, "none" and "0" look identical, and a front end that only checks "is there a value" will draw "none" as 0.
Ask your vendor: for fields that don't apply, do you return null, omit the field, or return 0?
For your engineers: keep a per-asset-type field allowlist so indices never read bid, ask or volume. Write one shared formatting function that distinguishes missing, empty and zero, instead of handling it page by page.
6. Time: some bar timestamps mark the start, some the end
A timestamp that doesn't say start or end doesn't say which moment.
The scenario: you're building an overlay chart of an A-share and a Hong Kong stock, or a cross-market minute-level backtest.
What I found:
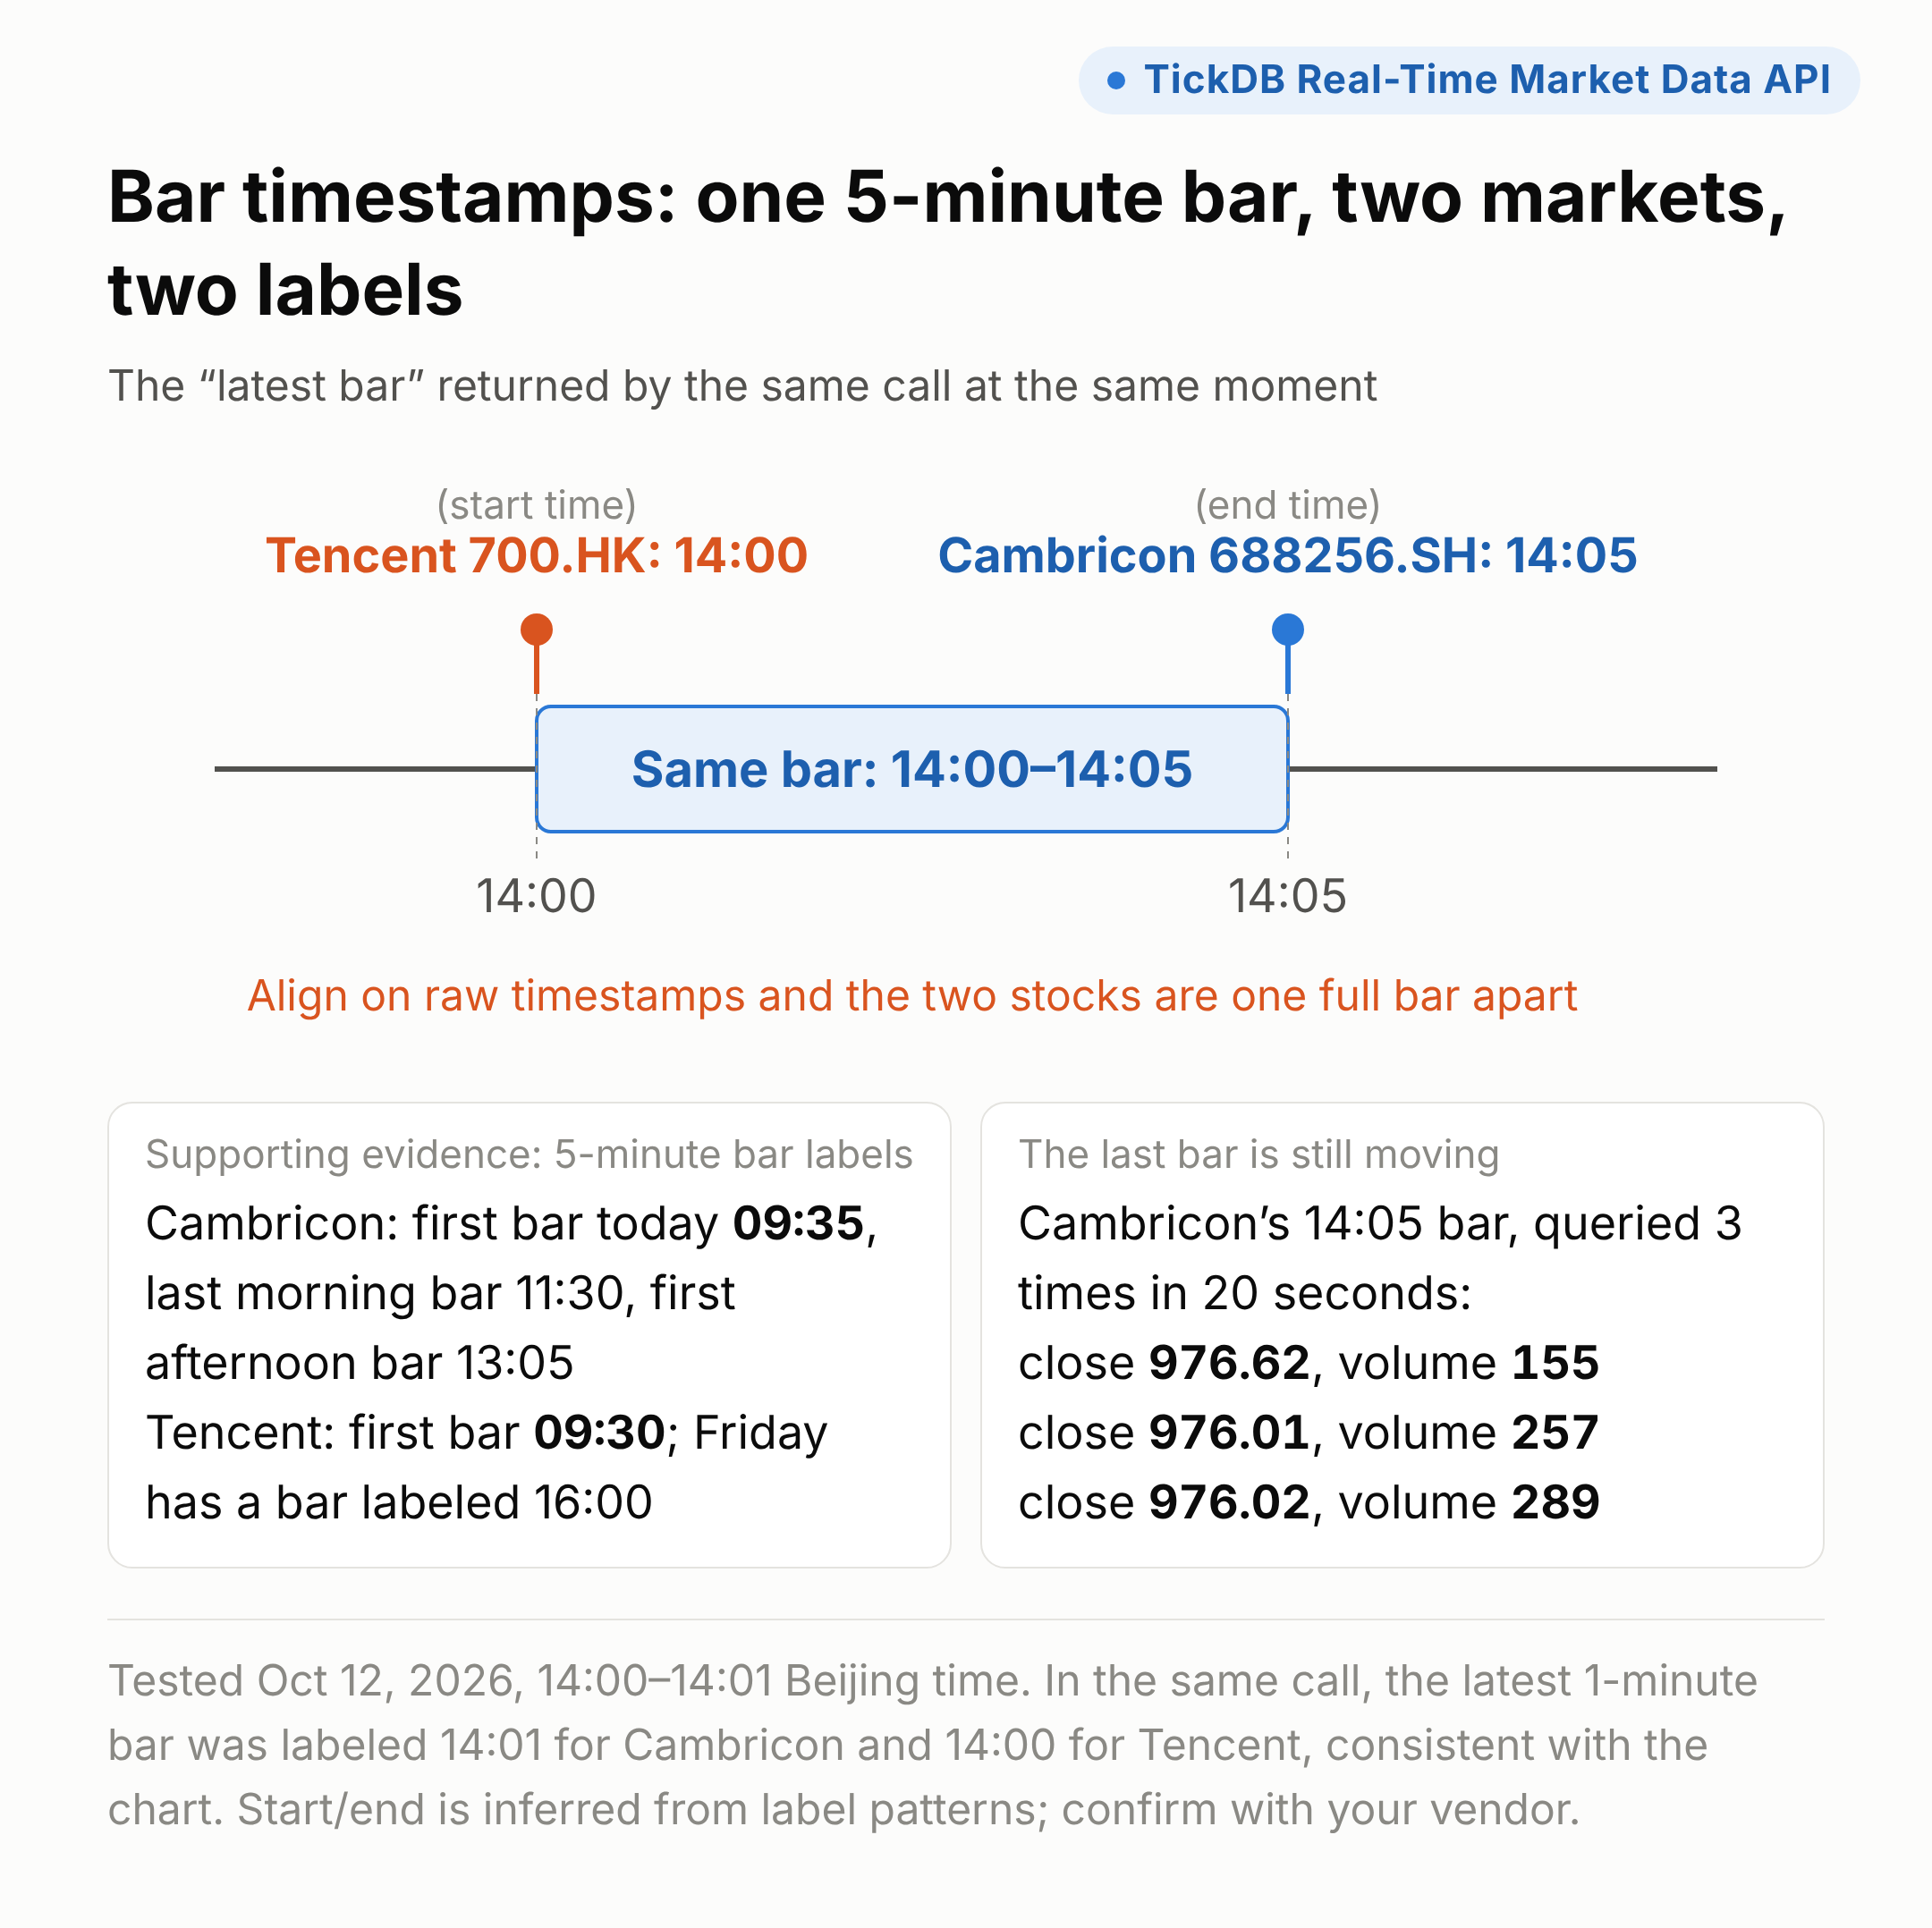
- At 2 p.m., the same call returning the latest 5-minute bar labeled Cambricon's bar 14:05 and Tencent's 14:00 — the same five minutes. The 1-minute bars matched: Cambricon 14:01, Tencent 14:00.
- Across the day's 5-minute bars, Cambricon's first bar is labeled 09:35, its last morning bar 11:30 and its first afternoon bar 13:05. Tencent's first bar is 09:30, and last Friday had a bar labeled 16:00 — Hong Kong's 16:00–16:10 closing auction.
- From these labels, A-share bars are stamped at each bar's end and Hong Kong bars at the start. (An inference; confirm with docs.)
- The last bar is still moving: I queried Cambricon's 14:05 bar three times in 20 seconds and got closes of 976.62, 976.01 and 976.02, with volume rising from 155 to 289.
How the money goes wrong: on an overlay chart the two stocks sit one full bar apart. Backtests pay more: align on raw timestamps and one market's signals will use data from five minutes in the future, inflating backtest returns that won't hold live. Daily bars too: at midday the API's "today's close" for Cambricon was 991.44, but by 2 p.m. the last price was 976.01. An intraday CSV export that treats the last bar as a close puts a close that hasn't happened yet into your reports.
Why: this isn't one vendor's quirk. When pandas resamples 1-minute data into 3-minute bars, it lets you label each bar by its left or right edge, so the same data can carry timestamps one period apart. QuantConnect stores two times for every bar, start and end, and only hands a bar to the algorithm once it has closed, precisely to stop backtests from seeing the future.
Concretum Group ran a comparison: the same opening-range breakout strategy, same code, parameters and dates, with only the data vendor changed. Ending capital ranged from about $226,000 to about $726,000, more than three times apart. Their conclusion: the disagreement wasn't in the strategy but in the data.
Ask your vendor: does the bar timestamp mark the start or the end? Is it the same in every market? When does the last bar count as closed?
For your engineers: store each bar as a start–end interval before aligning; flag the last row of any CSV export as "may be open"; never build a "closing bar" from the latest quote.
7. Status: order book depth is set by the market — say "not supported" when it isn't
Draw as many levels as are returned. For unsupported markets, say "not supported" — don't leave a blank.
The scenario: the front end hard-coded a five-level book for A-shares. Now it needs Hong Kong, US stocks and crypto.
What I found: the same order book endpoint returned 5 levels for Cambricon, 10 for Tencent, 1 for Apple (overnight) and 1,000 per side for BTC/USDT. Instruments without a book responded differently too: the S&P 500 returned "success" with both sides empty, while gold and EUR/USD returned an error.
How the money goes wrong: hard-code five levels and you lose half of Hong Kong's depth. With US stocks showing one level, the front end either draws four empty rows or "fills in" bid 2 to bid 5 that don't exist — fake depth that users may trade on, the most expensive error of all. A blank FX book makes users think the feed dropped, and another ticket arrives.
Why: depth is set by the market itself. A-shares show 5 levels, Hong Kong 10, the US overnight session may show only 1, crypto thousands, and an index none at all. The front end can't decide this.
Ask your vendor: how many levels do you return per market, and what do you return for markets you don't support?
For your engineers: draw the levels the API returns and label "N levels returned"; configure capabilities per market; show "no data," "not supported" and "request failed" as three different states.
The seven rework points at a glance
| Rework point | Price ID field | What this test showed | Ask your vendor |
|---|---|---|---|
| 1. One code, two instruments | Instrument | 000001 without a type returned an ambiguity error and two candidates | How do you handle code collisions? |
| 2. Volume units | Method | Cambricon in lots, Tencent in shares, 100× apart | What are the units per market? |
| 3. Two sessions | Session | Apple's quote is Friday's close, its book is today's overnight | Which session does each endpoint reflect? |
| 4. % change windows | Method | Bitcoin's prior close moved within a day; the A-share's didn't | What baseline and window? |
| 5. Zero vs none | Status | Index bid/ask returned 0 | What do non-applicable fields return? |
| 6. Bar timestamps | Time | Same 5 minutes: Cambricon 14:05, Tencent 14:00 | Start or end? |
| 7. Book depth | Status | 5, 10, 1, 1,000 levels; unsupported returns empty or an error | How many levels, and what if unsupported? |
The last column is seven questions you can send as-is. All tests on October 12, 2026, Beijing time.
Part 3 — Build or buy: do the math on these seven points
1. The rules keep changing: the cost of building is maintenance, not connection
Connecting a market data API really is a few lines of code. None of the seven points above is a hard coding problem. What's hard is that each one needs someone who knows the rules, and the rules keep changing. Just the second half of 2026:
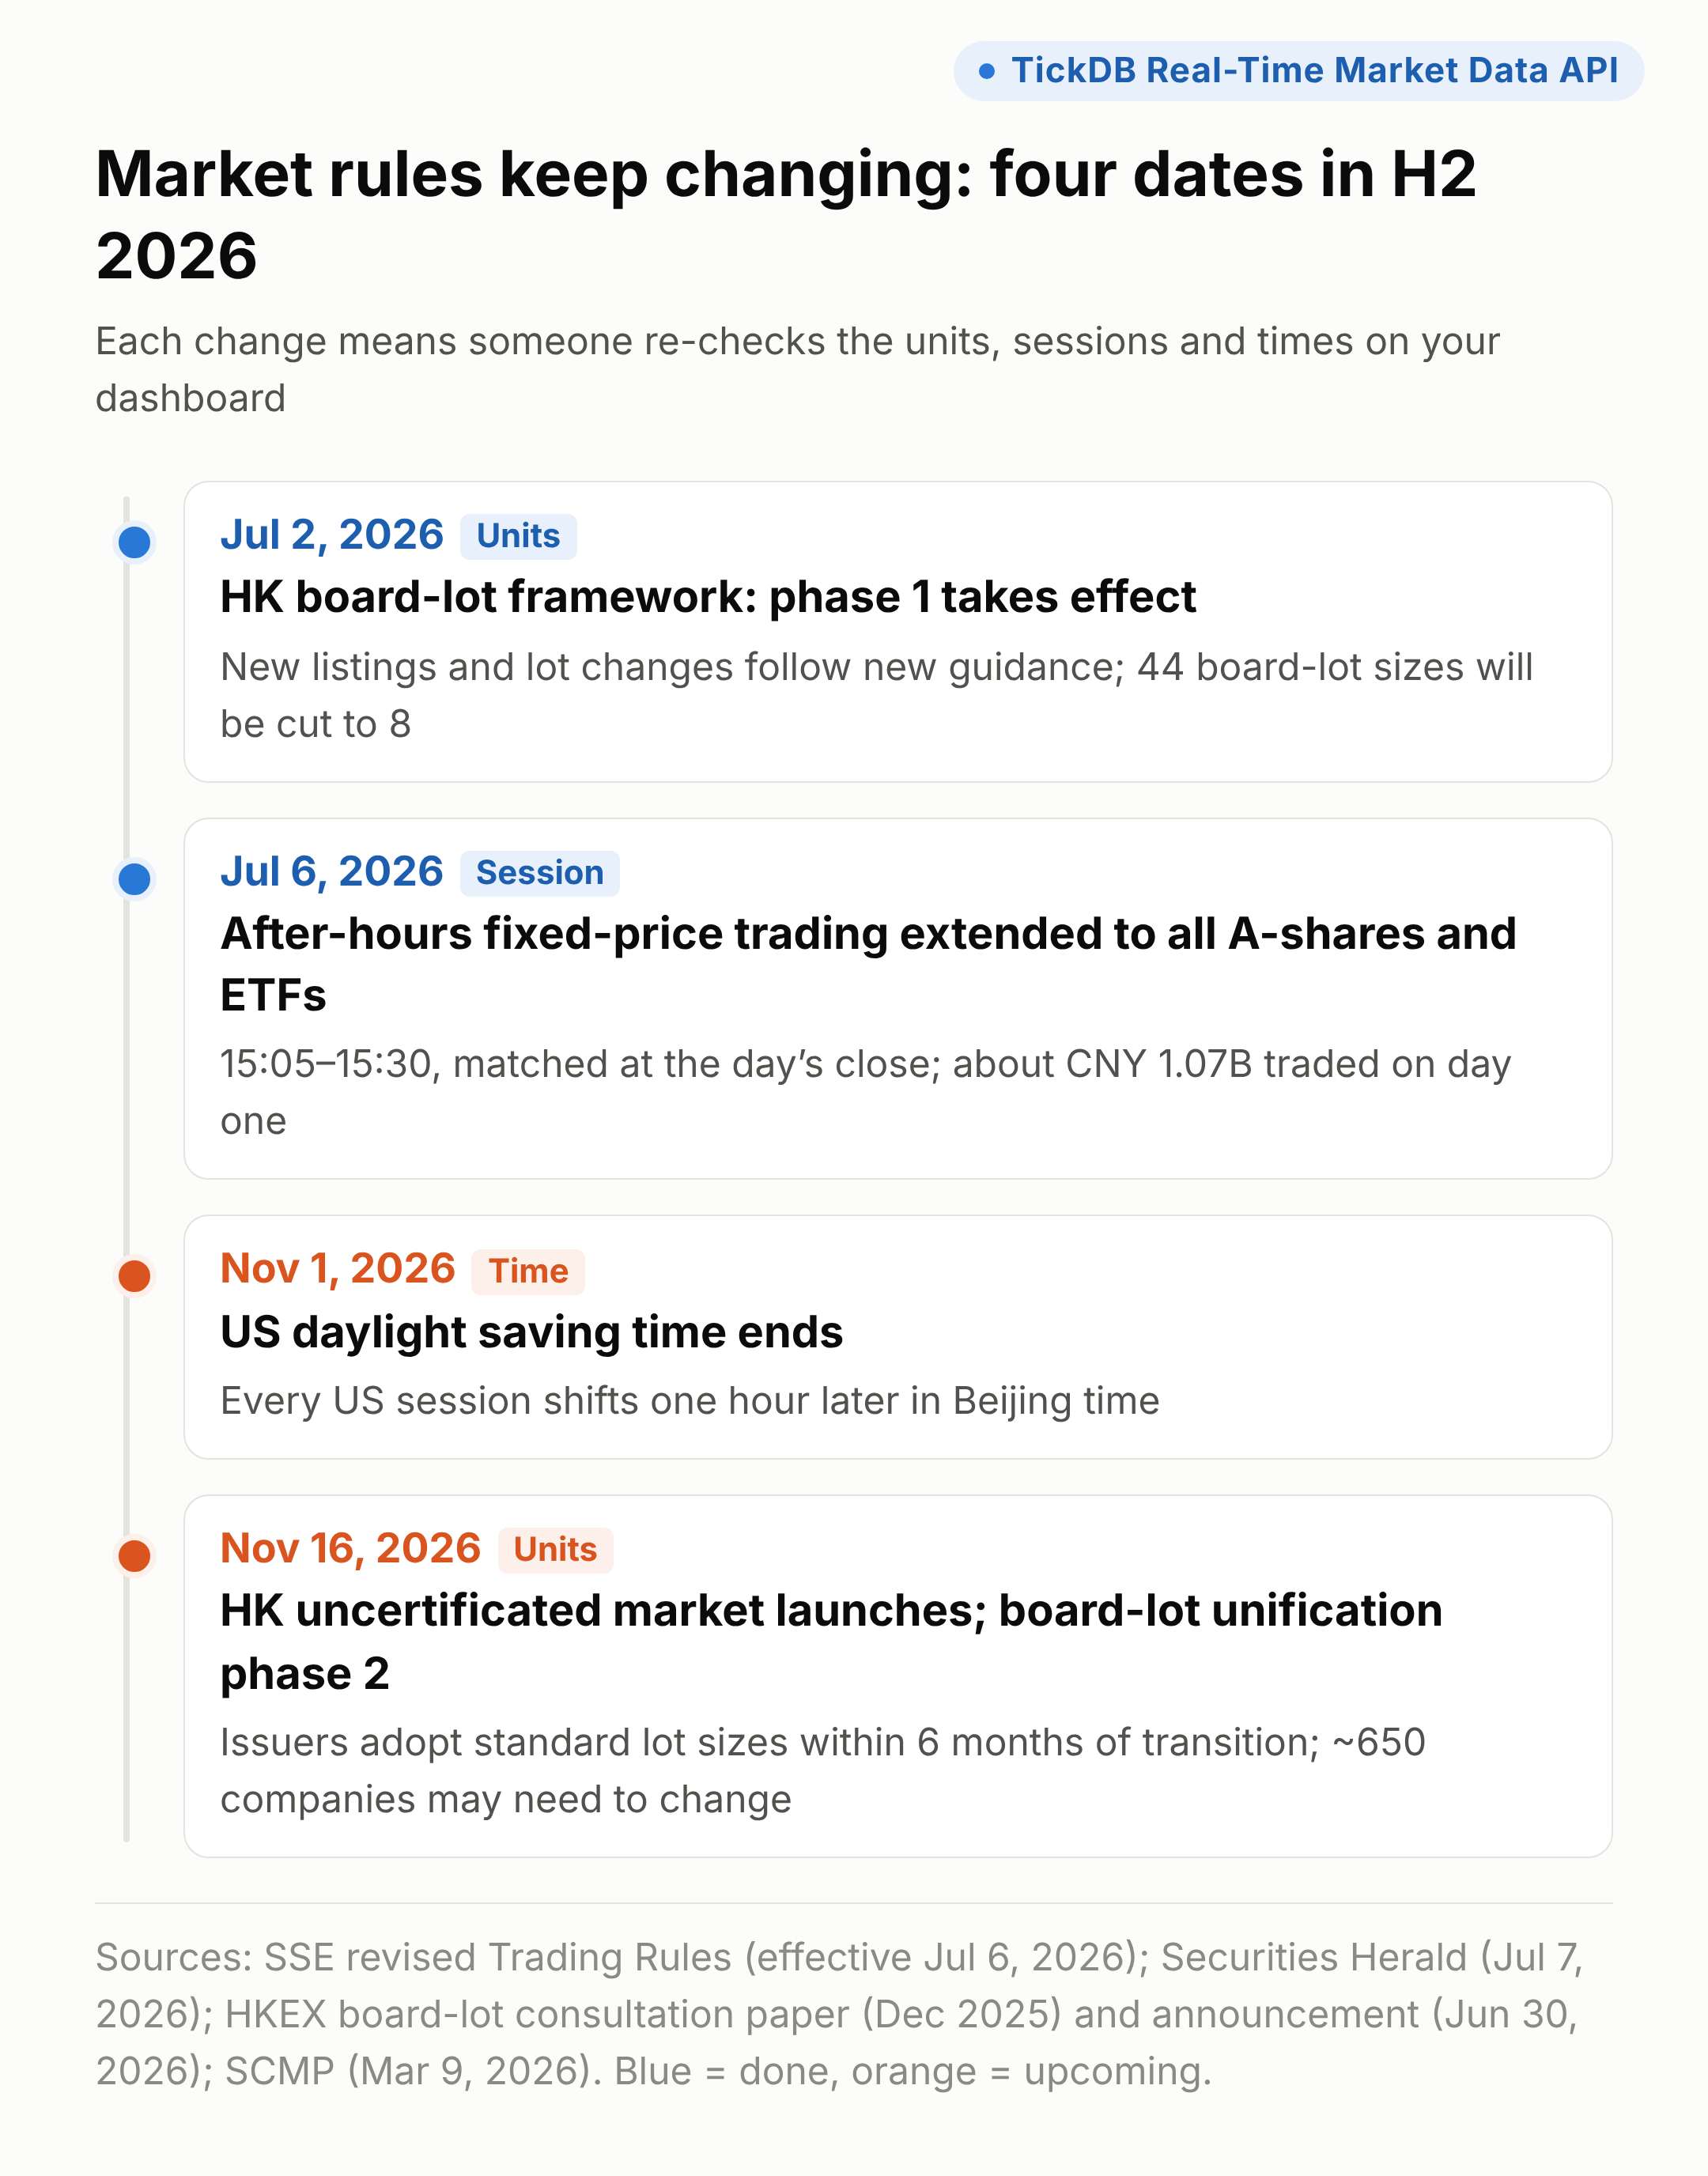
- July 2: phase one of HKEX's new board-lot framework took effect
- July 6: A-share after-hours fixed-price trading extended to all A-shares and ETFs, 15:05–15:30 at the closing price
- November 1: US daylight saving time ends, and every US session moves one hour later in Asian time
- November 16: Hong Kong's uncertificated securities market launches, and board-lot standardization enters phase two
Two of the four dates change units; two change sessions and time. They land exactly on rework points 2 and 3.
If you built the data layer yourself, every change needs an owner: someone to read HKEX notices, someone to decide whether A-share after-hours trades count in daily volume, someone to check every time display on the day the clocks change.
This isn't code you write once. Every rule change means someone rechecks all five fields of the price ID.
2. One ledger: what building means maintaining, what buying means verifying
| Rework point | If you build, you maintain | If you buy, you verify | Who decides |
|---|---|---|---|
| 1–2 Instrument and units | Instrument catalog, listings and delistings, code changes, unit tables per market | Is the catalog complete? Are units documented? | Product |
| 3 Session | Trading sessions, holiday calendar, A-share after-hours, US DST and overnight | Which session each endpoint returns, and how it's labeled | Product, quant |
| 4–5 Windows and missing values | Change window per asset class; which fields apply | Are windows and "not applicable" documented? | Product, risk |
| 6 Time | Bar time convention, last-bar handling, time zones | Start or end? When does the last bar close? | Quant, engineering |
| 7 Capability | Depth per market, plan permissions, error categories | Are depth, permissions and error codes documented? | Business, engineering |
Building makes the middle two columns your job. Buying hands over the maintenance and keeps "getting clear answers" as your job.
Buying doesn't outsource these seven questions. Every question a vendor cannot answer becomes your maintenance item again.
Market data is a big business: according to Burton-Taylor, global spending on financial market data and analysis grew 6.5% in 2025 to $49.2 billion. It also shows that "connect a free API" and "buy data that can answer these five fields" are two different costs, not the free and paid versions of the same thing.
Each role signs one line:
- Executives: "add one more market" isn't half a day of work. Budget time to check units, sessions, windows and depth, and decide who tracks rule changes.
- Product managers: does every number show its window, unit and time? The one that doesn't is the next question a customer will ask you.
- Business and procurement: send the seven questions below. You don't need "supported" for everything, but you need a clear answer to everything; anything unclear doesn't go to production.
3. Seven questions for your data vendor
Copy as-is:
- When codes collide, do you return an error, pick a default, or silently return one?
- What are the units for volume, order book quantity and trade quantity in each market?
- Which session do snapshot, order book and trades each reflect? Are A-share after-hours trades after 15:05 included in daily volume?
- For each asset class, what are the baseline and window for % change? How does the prior close change when the market is closed?
- For fields that don't apply (such as an index's bid, ask and volume), do you return null, omit the field, or return 0?
- Does a bar's timestamp mark its start or its end? Is it the same in every market? When does the last bar count as closed?
- How many order book levels do you return per market, and what do you return for markets you don't support?
4. Two snippets that give every number a price ID
This section is for your engineers.
TickDB provides a unified global market data API for developers and AI applications, giving teams real-time and historical data across major markets — including US, Hong Kong and China A-shares — through a single integration, so they can ship market data, analytics and monitoring products faster.
I ran the checks above against TickDB's snapshot endpoint. These two snippets are the core of the panel's watchlist: request by asset type, check return codes, then attach a window, unit and time to every number.
Snippet 1 batches snapshots by asset type and attaches a price ID
import os
import requests

API_KEY = os.environ["TICKDB_API_KEY"]  # keep it on the server, never in front-end code
BASE = "https://api.tickdb.ai/v1/market/ticker"

# Price ID metadata is configured per instrument, never inferred from the suffix
WATCHLIST = {
    "stock":   {"688256.SH": {"unit": "lots",   "window": "today"},
                "700.HK":    {"unit": "shares", "window": "today"},
                "AAPL.US":   {"unit": "shares", "window": "regular_session"}},
    "forex":   {"EURUSD": {"unit": None, "window": "today"},
                "XAUUSD": {"unit": None, "window": "today"}},
    "indices": {"SPX": {"unit": None, "window": None}},      # indices: don't read bid/ask or volume
    "crypto":  {"BTCUSDT": {"unit": "BTC", "window": "rolling_24h"}},
}

def fetch(type_, symbols):
    resp = requests.get(BASE, params={"symbols": ",".join(symbols), "type": type_},
                        headers={"X-API-Key": API_KEY}, timeout=10)  # max 50 symbols per request
    body = resp.json()
    if resp.status_code != 200 or body.get("code") != 0:
        # e.g. "000001" without a type returns an ambiguity error with candidates
        raise RuntimeError(f"{type_}: {resp.status_code} {body.get('code')} {body.get('message')}")
    return body["data"]

rows = []
for type_, items in WATCHLIST.items():
    for q in fetch(type_, list(items)):
        meta = items[q["symbol"]]
        rows.append({
            "symbol": q["symbol"], "type": type_,
            "price": q.get("last_price"),              # keep the string; format at display time
            "time_ms": q.get("timestamp"),              # every number carries its own time
            "change_pct": q.get("price_change_percent_24h") if meta["window"] else None,
            "window": meta["window"],
            "volume": q.get("volume_24h") if meta["unit"] else None,
            "turnover": q.get("quote_volume_24h"),
            "unit": meta["unit"],
            "overnight": q.get("overnight_quote"),      # store US overnight separately; don't overwrite the main snapshot
        })
Snippet 2 checks volume units against turnover and price
from decimal import Decimal, InvalidOperation

def unit_ratio(row):
    """Return turnover / volume / price: ~1 means shares, ~100 means lots; None if anything is missing."""
    try:
        price, vol, turnover = (Decimal(str(row[k])) for k in ("price", "volume", "turnover"))
    except (InvalidOperation, TypeError, KeyError):
        return None
    if price <= 0 or vol <= 0:
        return None
    return round(turnover / vol / price, 1)

for r in rows:
    if r["unit"] in ("lots", "shares"):
        ratio = unit_ratio(r)
        expected = 100 if r["unit"] == "lots" else 1
        flag = "OK" if ratio is not None and abs(ratio - expected) / expected < 0.05 else "CHECK"
        print(r["symbol"], r["unit"], ratio, flag)
On my October 12 data: Cambricon about 100, Tencent about 1, Apple about 0.99. If a ratio suddenly jumps, check whether the unit changed.
| What it does / where it stops | How to verify |
|---|---|
| One snapshot endpoint covers stocks, FX, precious metals, indices and crypto, requested in batches by type | The seven instruments in this panel |
| Ambiguous codes return an error with candidates instead of a guess | Query "000001" without a type |
| US pre-market, after-hours and overnight data are stored separately with their own times; US trades are tagged with their session | Query Apple's snapshot and recent trades |
| Limit: volume units and bar timestamp meaning per market are inferred from responses in this piece | Confirm with the docs before integrating |
| Limit: FX, precious metals and indices have no order book or trade feed; the trading-sessions endpoint doesn't list the A-share closing auction or after-hours session | See rework points 3 and 7 |
The first three rows are what this test shows; the last two are its limits. Results describe these calls only, not every market or session. Tested October 12, 2026.
What changes if you do this: skip it, and a 100× turnover error reaches your reports, support explains "which price is real" every day, and backtests inflate from misaligned timestamps. Do it, and snippet 2 checks units automatically, every number carries its window and time, and seven questions hold every vendor to the same standard.
One example: a product manager running a Hong Kong dashboard runs snippet 2 before adding A-shares, sees Cambricon at about 100 and Tencent at about 1, labels A-share volume "lots," and converts the CNY 500,000 large-trade threshold to lots before launch. (A scenario worked from my October 12 data.)
These snippets check integration-layer behavior only. Ratios can drift slightly near the open and around auctions; tune thresholds for your instruments.
FAQ
Do mainland China stocks and Hong Kong stocks use the same volume unit?
No. In the API I tested, A-shares report volume in lots of 100 shares and Hong Kong in shares. Check it yourself with turnover ÷ volume ÷ price: about 100 for Cambricon, about 1 for Tencent. Confirm with your vendor's docs before integrating.
When do mainland China stocks close now and is there trading after the close?
Continuous trading runs to 14:57, followed by the closing call auction from 14:57 to 15:00. Since July 6, 2026, all A-shares and ETFs also have an after-hours fixed-price session from 15:05 to 15:30, matched at that day's closing price.
Does a bar timestamp mark the start or the end of the bar?
It can differ by market and by vendor. In my test, the same 14:00–14:05 bar was labeled 14:05 for Cambricon and 14:00 for Tencent. Confirm with your vendor and align bars as start–end intervals.
Can percent changes from different asset classes share one ranking?
Not as-is. Stocks use the trading day and crypto a rolling 24 hours; with different windows, comparing sizes is meaningless. If you need one ranking, recompute every instrument over the same window from bars.
One last question
Can the most prominent number on your dashboard state all five fields of its price ID?
One thing you can do today: take a screenshot of your dashboard and write the unit, window and time next to every number. The one you can't fill in is your first rework point.
References
All accessed October 12, 2026.
- Shanghai Stock Exchange, Trading Rules (2026 revision, effective July 6); Guangming Online report, July 6, 2026
- Securities Herald, report on the first day of after-hours fixed-price trading, July 7, 2026
- HKEX, board-lot framework consultation paper (December 2025) and implementation announcement (June 30, 2026); SCMP report, March 9, 2026
- HKEX, Trading Mechanism of CAS in the Securities Market (April 10, 2026 version)
- The Paper, report on STAR Market order rules, August 11, 2023
- pandas documentation,
labelandclosedparameters ofresample - QuantConnect documentation, data timing and bar Time / EndTime
- Concretum Group, "Can You Trust Your Intraday Database?" and companion articles
- Binance official API documentation, 24-hour ticker definition
- Burton-Taylor International Consulting research (reported by FOW, April 8, 2026)
- TickDB, market data API documentation and author's test records