Same Gold Price, −0.69% or +0.24%: Why % Change Breaks in Cross-Market Data Apps
TickDB Research ·
At one moment, at one gold price, the daily change can read −0.69% or +0.24%. In a cross-market data app, the number users screenshot and complain about is rarely the price. It's the red or green percentage next to it. This piece walks through the four places it breaks — gainers lists, price alerts, portfolio pages and home-versus-detail screens — and ends with a per-market baseline checklist.
What you get, based on exchange and benchmark rules plus my own tests across six asset classes on October 12–13, 2026:
- Four product scenarios where % change goes wrong: what users see, why, what it costs and how to fix it
- A cross-market baseline checklist: what each market's % change should be measured against, and what the screen should say
- Five questions for your data vendor
- A Python snippet that recomputes % change on a common baseline and flags China A-share ex-dates
One gold price, five answers
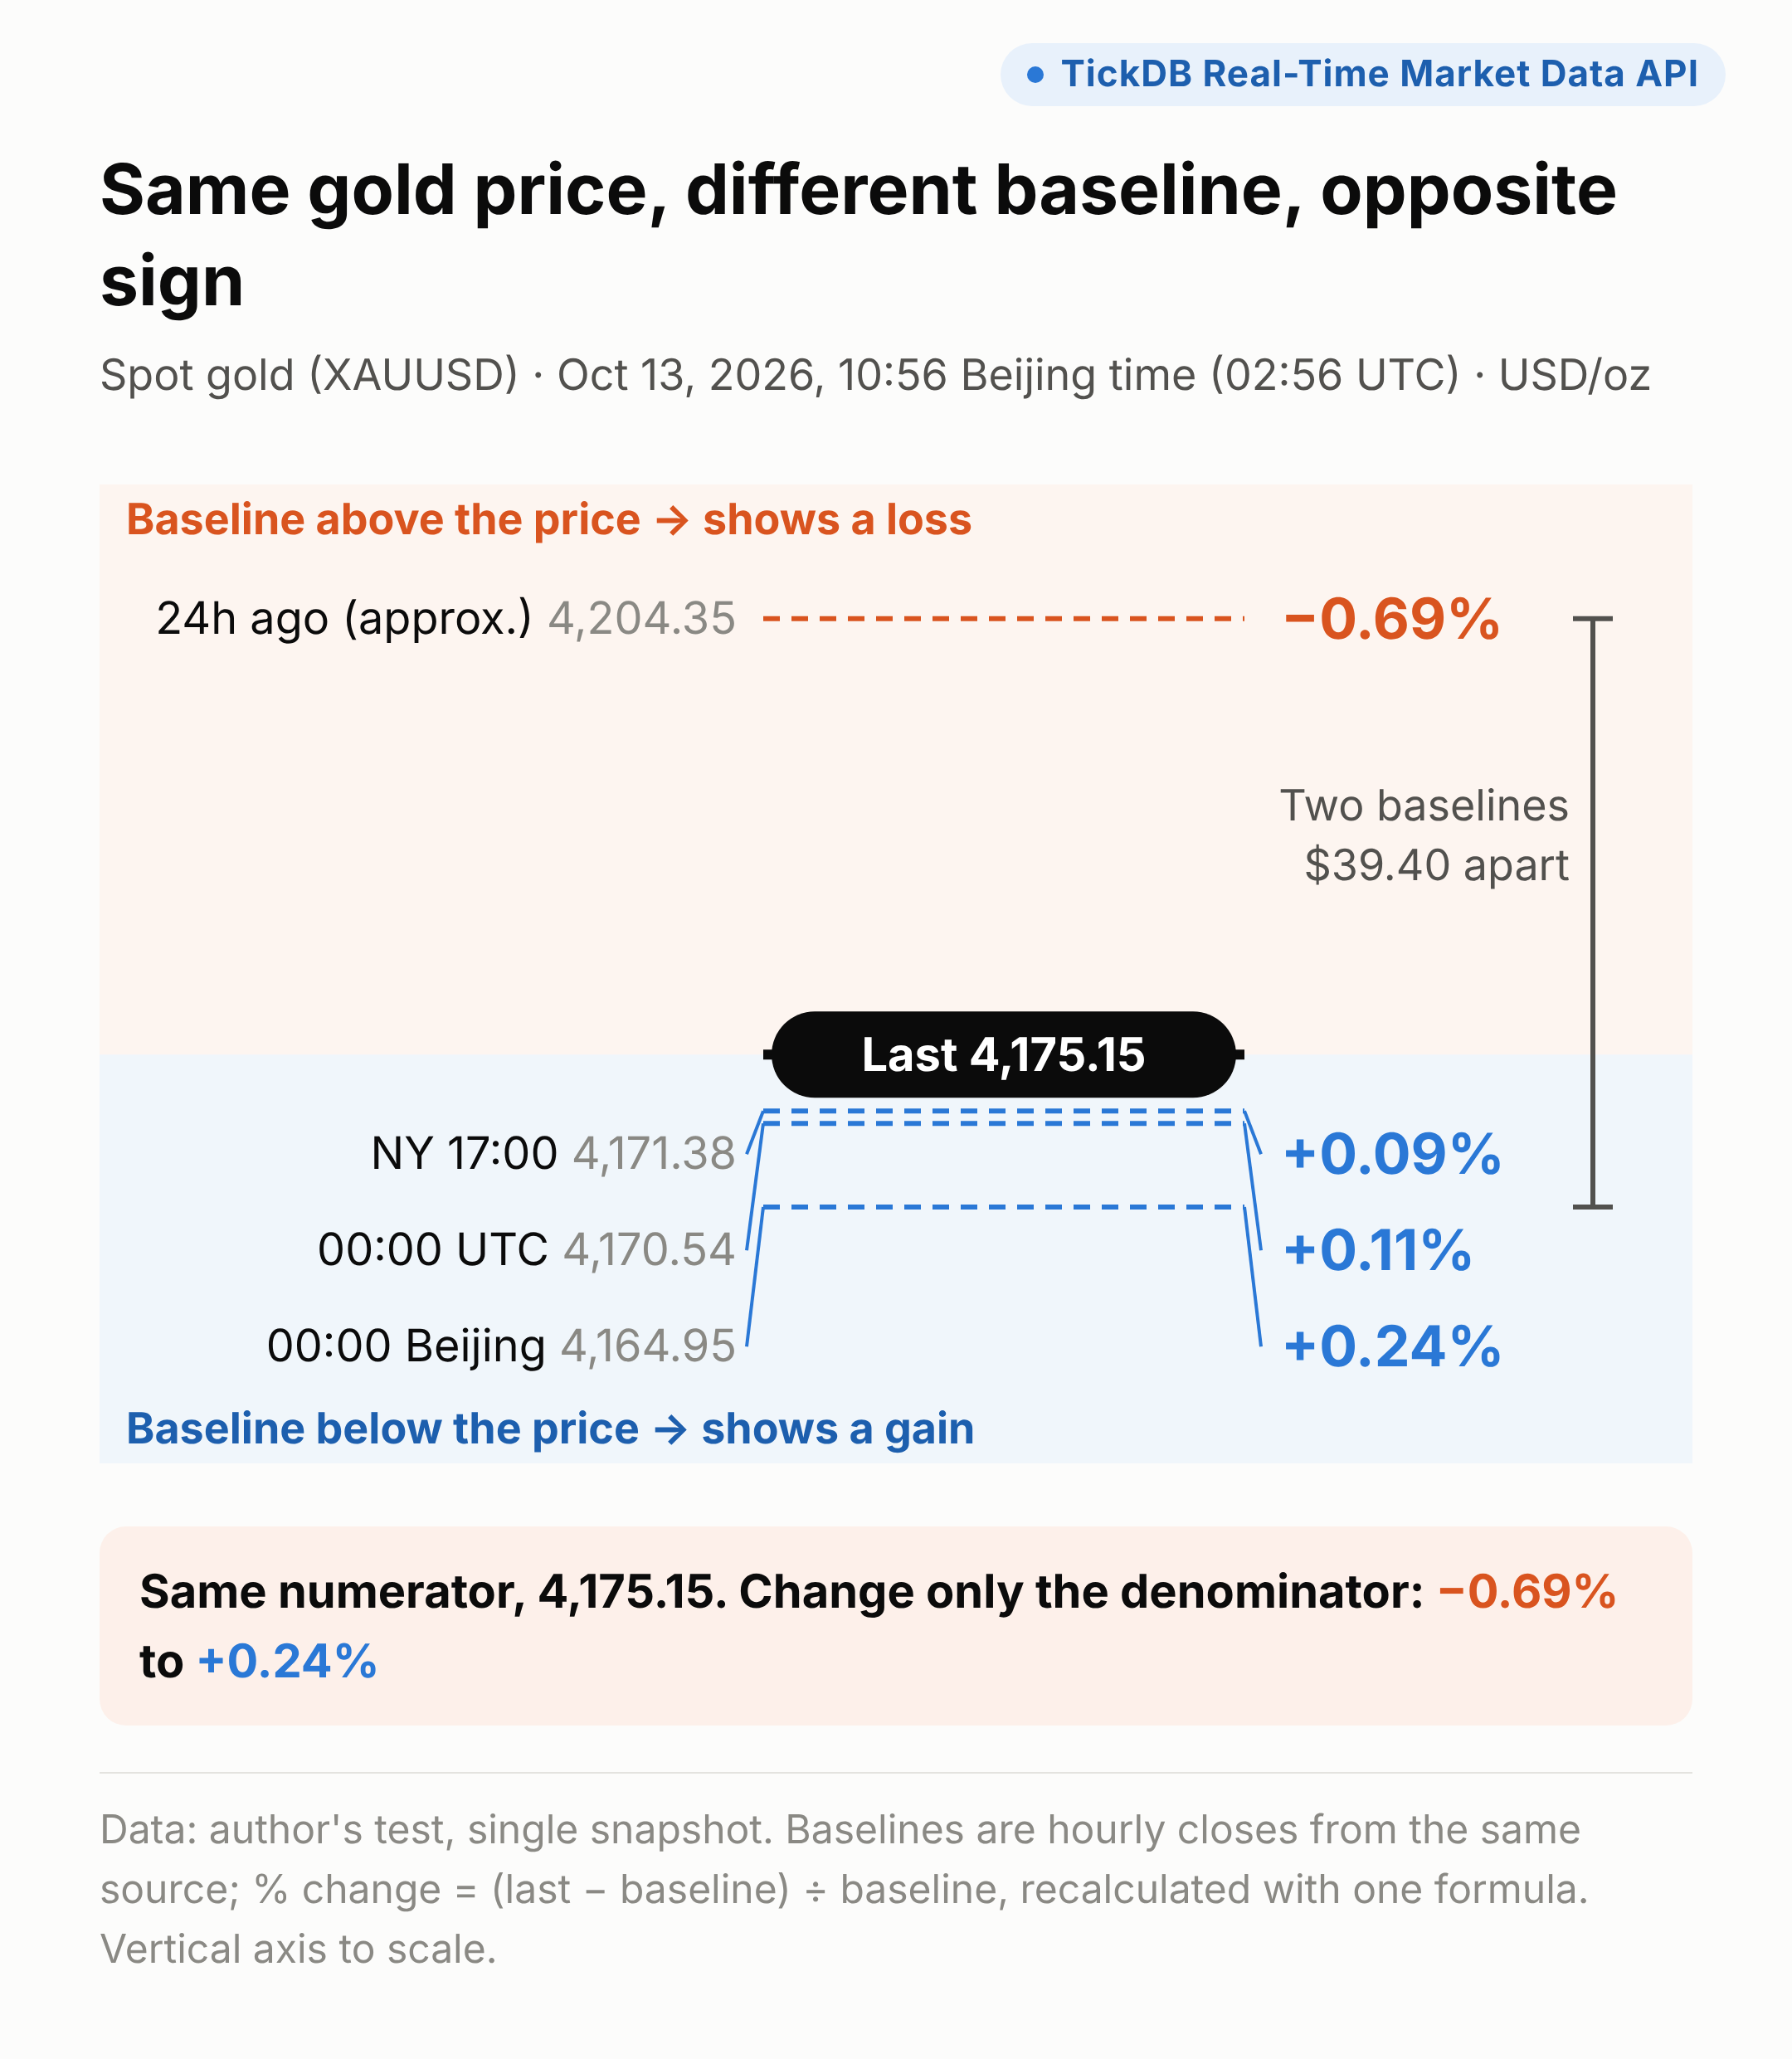
Tuesday, October 13, 2026, 10:56 Beijing time (02:56 UTC). Spot gold: $4,175.15. I computed its daily change five common ways:
| Compared with | Baseline (USD) | Change |
|---|---|---|
| 24 hours earlier (approx.) | 4,204.35 | −0.69% |
| "Prior close" from the API I tested | 4,190.27 | −0.36% |
| New York 17:00 | 4,171.38 | +0.09% |
| 00:00 UTC (daily bar close) | 4,170.54 | +0.11% |
| 00:00 Beijing | 4,164.95 | +0.24% |
Single snapshot. All baselines come from the same source's bars, and every change is recomputed with one formula, so you can check the math.
Put money on it: on 100 ounces, the "24 hours earlier" baseline shows a loss of about $2,920 for the day; the "midnight Beijing" baseline shows a gain of about $1,020. A $3,940 swing. Two apps can paint the same price in opposite colors, and neither has made a mistake.
Gold is just one instrument. Put China A-shares, Hong Kong, US stocks, FX and crypto in one app and this multiplies. On Cambricon's ex-dividend date, its daily bar showed a "36.7% crash" that was really a 5.6% drop. One Apple share showed +1.29% on a home screen and +0.47% on its detail page. Bitcoin's "today" turned out to mean the past 24 hours.
In a cross-market data app, percent change is not a field you can display as is. It's a division: the numerator is the last price, the same everywhere; the denominator is "compared with what," and every market answers differently. Put it on screen without unifying the denominator and it breaks in four places at once.
This is written for people who build market data products — executives, product managers, operations and engineers — and for anyone who checks a trading app every day.
The one line to remember: before you read a change, ask what it is compared with.
Part 1 — Why % changes don't match, in one minute
% change = (last − baseline) ÷ baseline. The last price is shared; the disagreement is all in the baseline.
The previous piece in this series, Building a Multi-Market Stock Dashboard: 7 Things That Break After the Demo, proposed a check for every number on screen: can it state its instrument, session, method, time and status? % change is the most common, and most error-prone, number in the "method" field.
Take it apart and three questions decide the baseline:
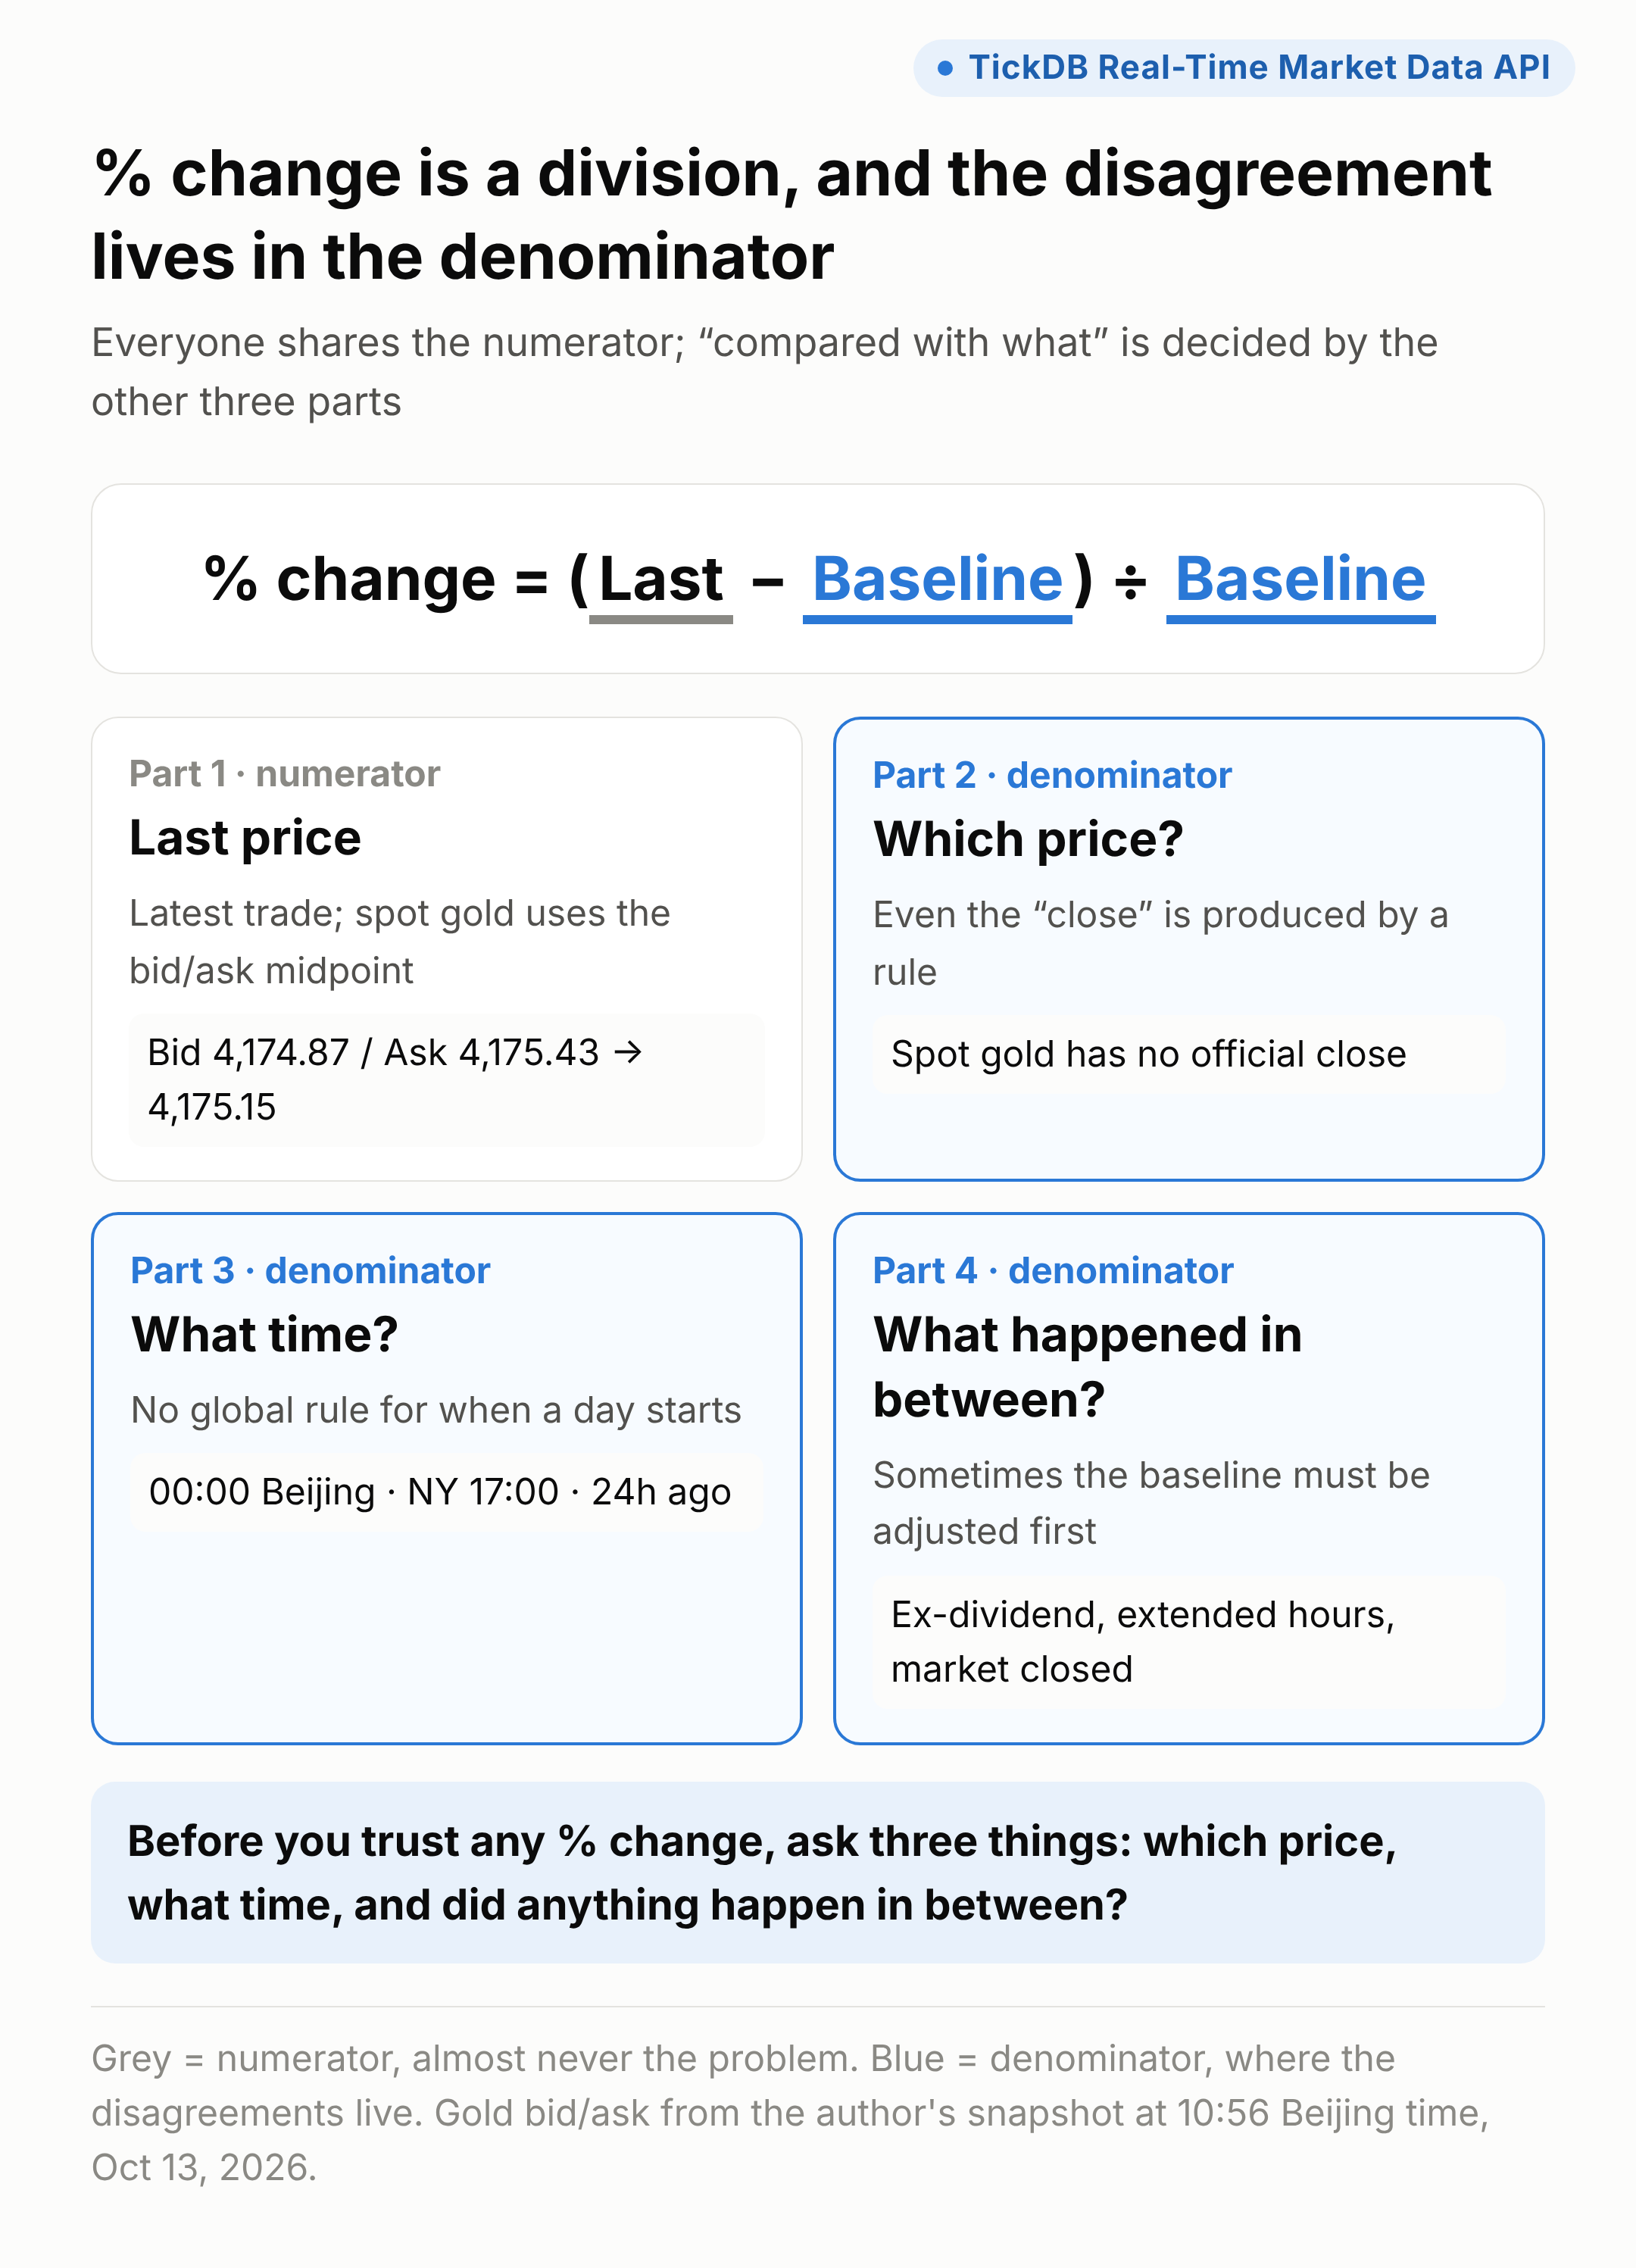
- Which price? Yesterday's close, the price at some hour, or an ex-dividend reference price.
- What time? Does "today" start at midnight Beijing, midnight UTC, 17:00 New York — or is it just "the past 24 hours"?
- What happened in between? A dividend or share bonus, a session change (after-hours, overnight), or a market closure.
Even "the close" is produced by a rule. Since August 20, 2018, the Shanghai Stock Exchange has set the closing price of stocks in a 14:57–15:00 closing call auction, during which orders can be entered but not cancelled. Nasdaq's official closing price comes from its 16:00 Closing Cross. Spot gold has no official close at all. Each market's rules differ, so does its default baseline:
| Market | % change usually measured against | Where it most often goes wrong |
|---|---|---|
| China A-shares | Previous trading day's close | On ex-dates, the reference price replaces the close |
| Hong Kong | Previous close (set by the closing auction session) | Its window differs from US stocks and crypto in a mixed ranking |
| US stocks | Previous regular-session close | Pre-market, after-hours and overnight each use other baselines |
| Gold, FX | No official close: NY 17:00, 00:00 UTC and 00:00 Beijing are all used | Sunday's open can create a stub "daily" bar |
| Crypto | No close: rolling 24 hours, or a user-chosen midnight | The window moves every moment |
| Indices | Previous close | While the market is shut, providers display it differently |
One market per app, and this is manageable. Six markets on one screen, and these six rule sets collide. Here are the four places they collide most.
Part 2 — Four scenarios: where money and trust leak
Every scenario is the same mistake: % changes with different denominators shown side by side as if they were the same kind of number.
Scenario 1 — Gainers lists and watchlists: rank across markets and the order is meaningless
What users see: a watchlist sorted by % change. Apple is first at +1.29%; Bitcoin is last at −1.07%.
What went wrong: those five changes cover five different stretches of time.
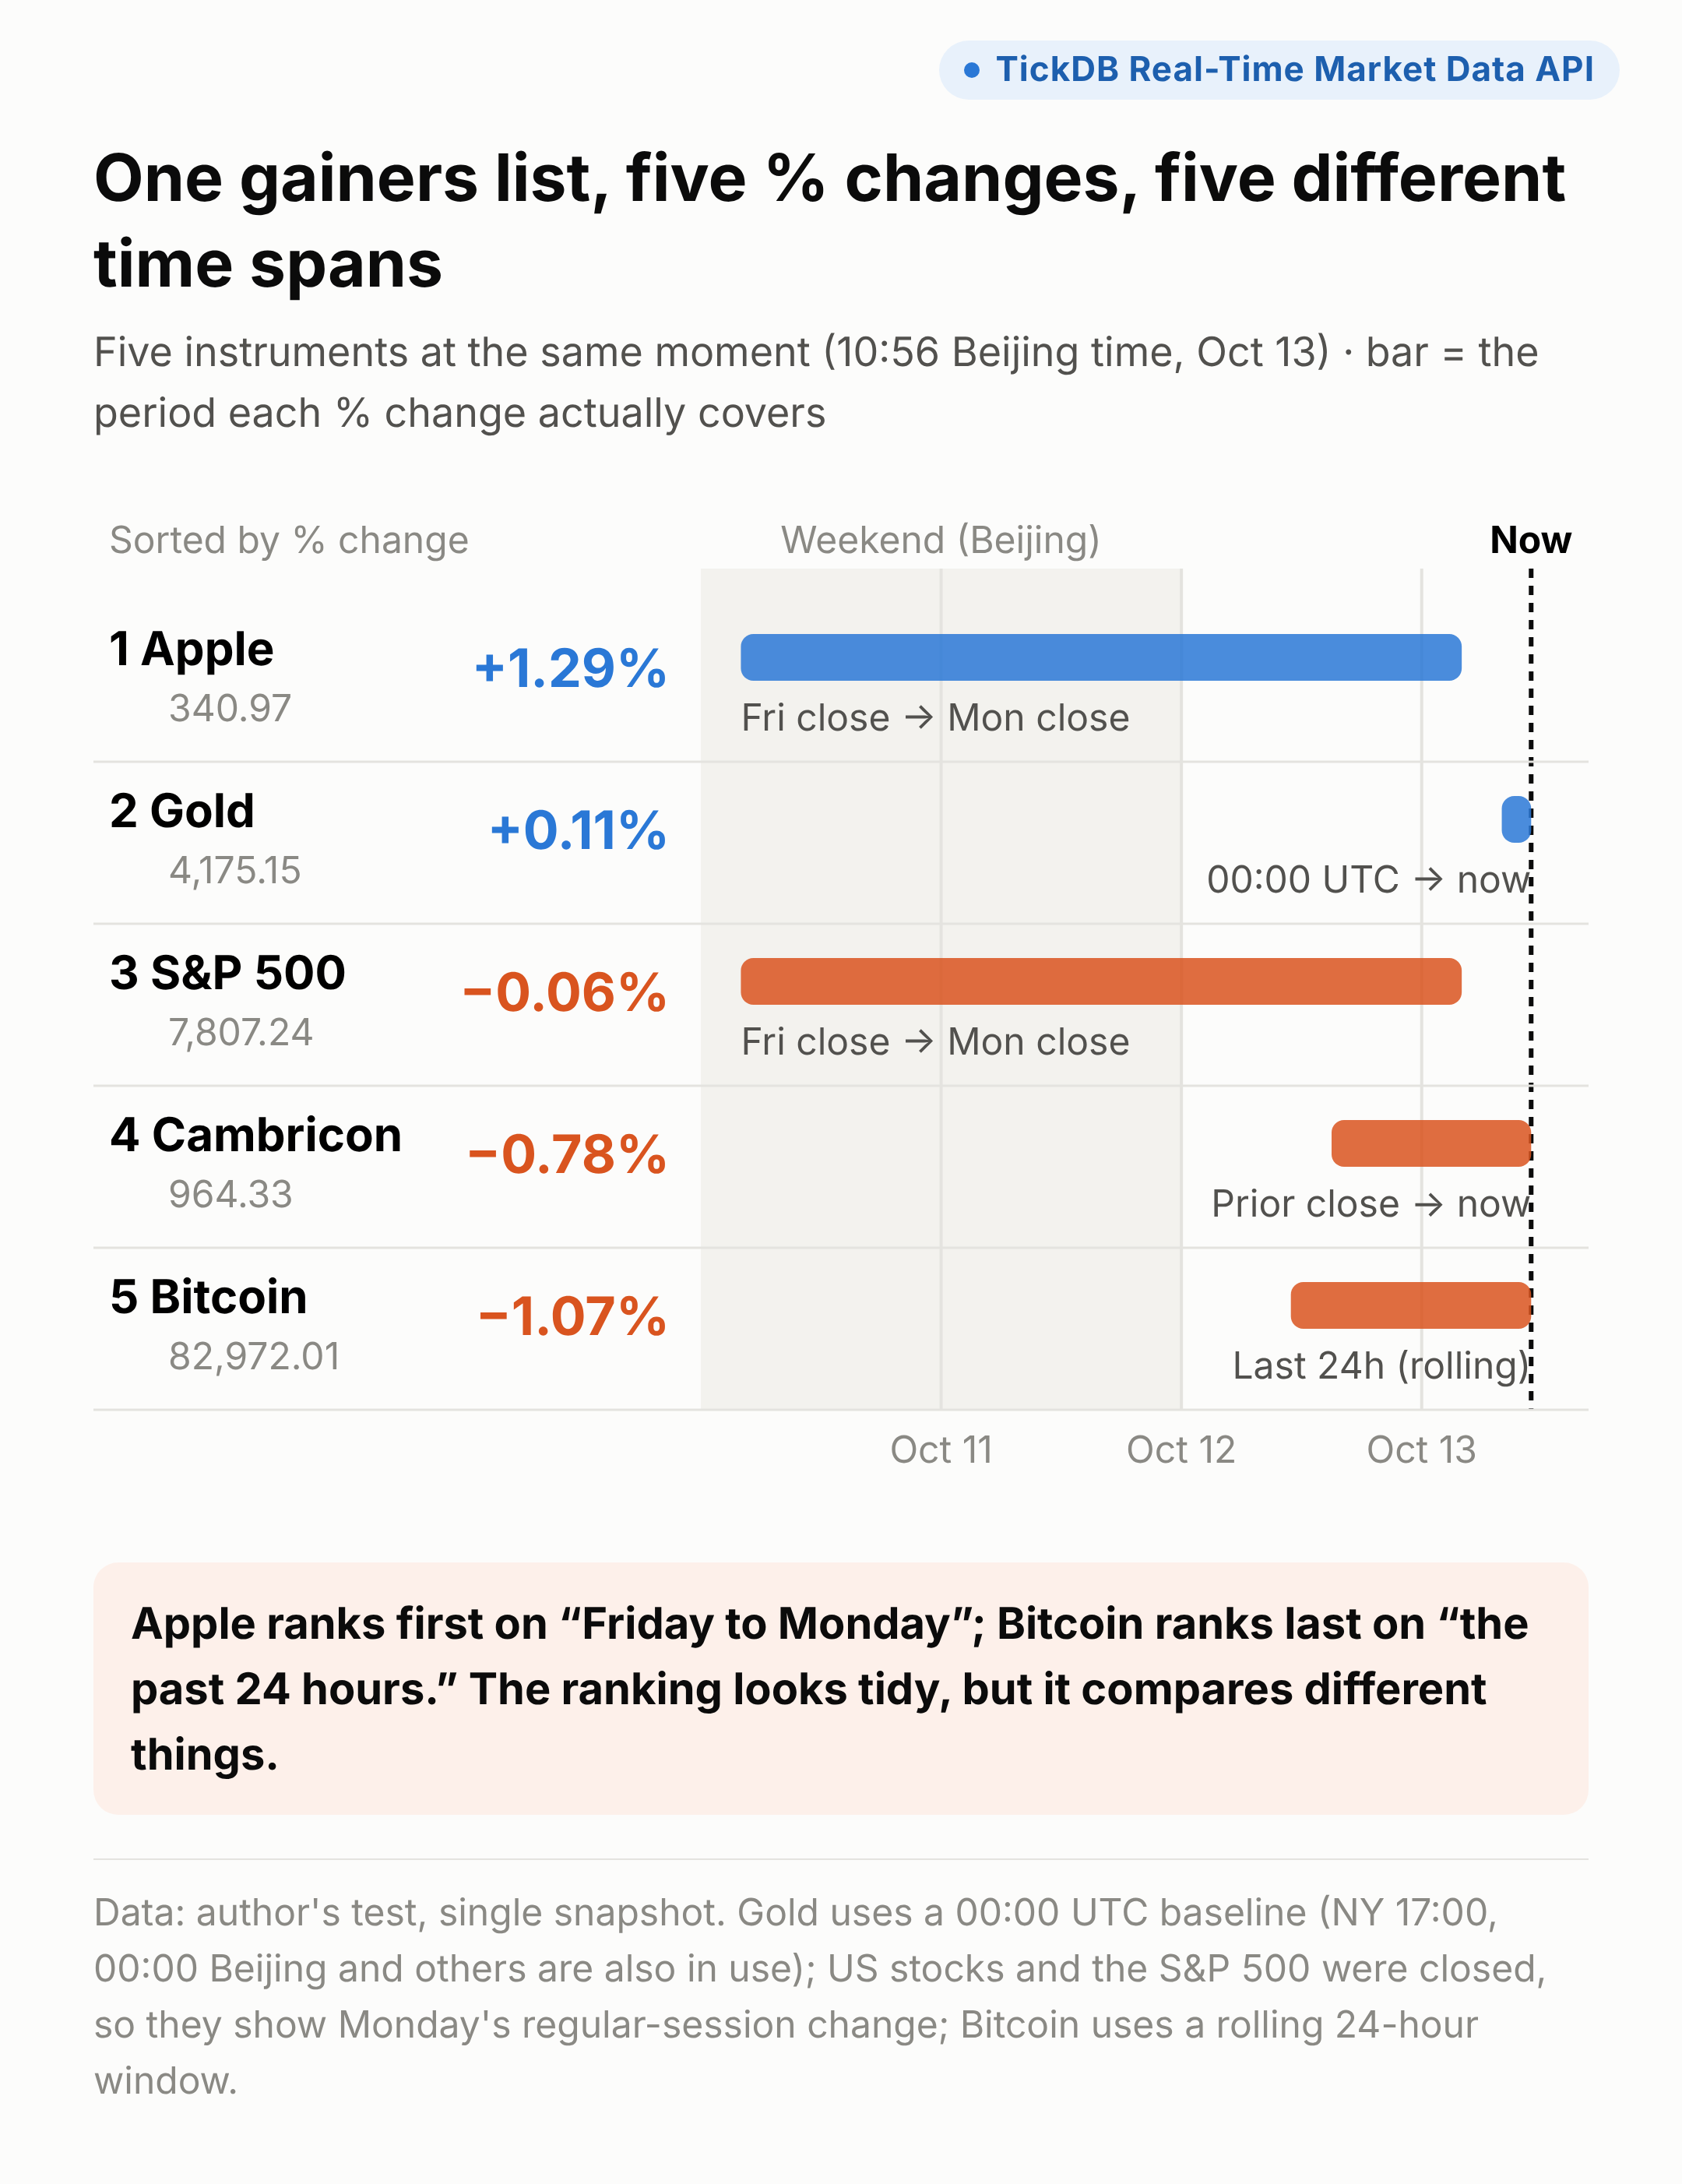
- Apple and the S&P 500: US markets were closed during the Asian morning, so they show Friday's close to Monday's close.
- Cambricon: yesterday's close to now.
- Gold: depends on when you start the day; the chart uses 00:00 UTC.
- Bitcoin: the past 24 hours, and the window keeps sliding. I queried its "prior close" three times: 83,049.15 at 11:08 on October 12, 83,074.01 at 14:01 the same day and 83,866.01 at 10:56 on October 13. Two queries on the same day, two different denominators. Binance's official API docs define its 24-hour ticker as a rolling-window statistic; Gate lets users choose between "Last 24 hours," "UTC+8 00:00" and "UTC 00:00."
Indices add another twist. The S&P 500 showed 0.00% during the Beijing daytime on October 12 (prior close and last price both 7,811.54) and −0.06% on the morning of October 13 (Monday's move). Same situation — US markets closed, Asian daytime — but one day shows zero and the next shows the previous session's change.
What it costs: the ranking has no meaning. Users chasing "today's strongest" may be chasing a move from two days ago. An operations team running a cross-market gainers campaign may crown something that didn't rise the most. An index showing 0.00% while closed looks flat to users when it simply hasn't opened.
How to fix it: before ranking across markets, recompute every instrument over one window from bars (for example "since 00:00 Beijing today"), then sort. Label closed instruments "closed" and keep them out of the live ranking.
Ask your vendor: what time and time zone does the % change baseline use, and what do you show when the market is closed?
Scenario 2 — Price alerts: same threshold, one fires and one doesn't
What users see: a user sets "alert me if gold drops 0.5%." At the same moment, platform A sends the alert and platform B doesn't.
What went wrong: against "24 hours earlier" the change is −0.69%, so the alert fires; against "midnight Beijing" it's +0.24%, so it doesn't. Neither platform miscalculated. The denominators differ.
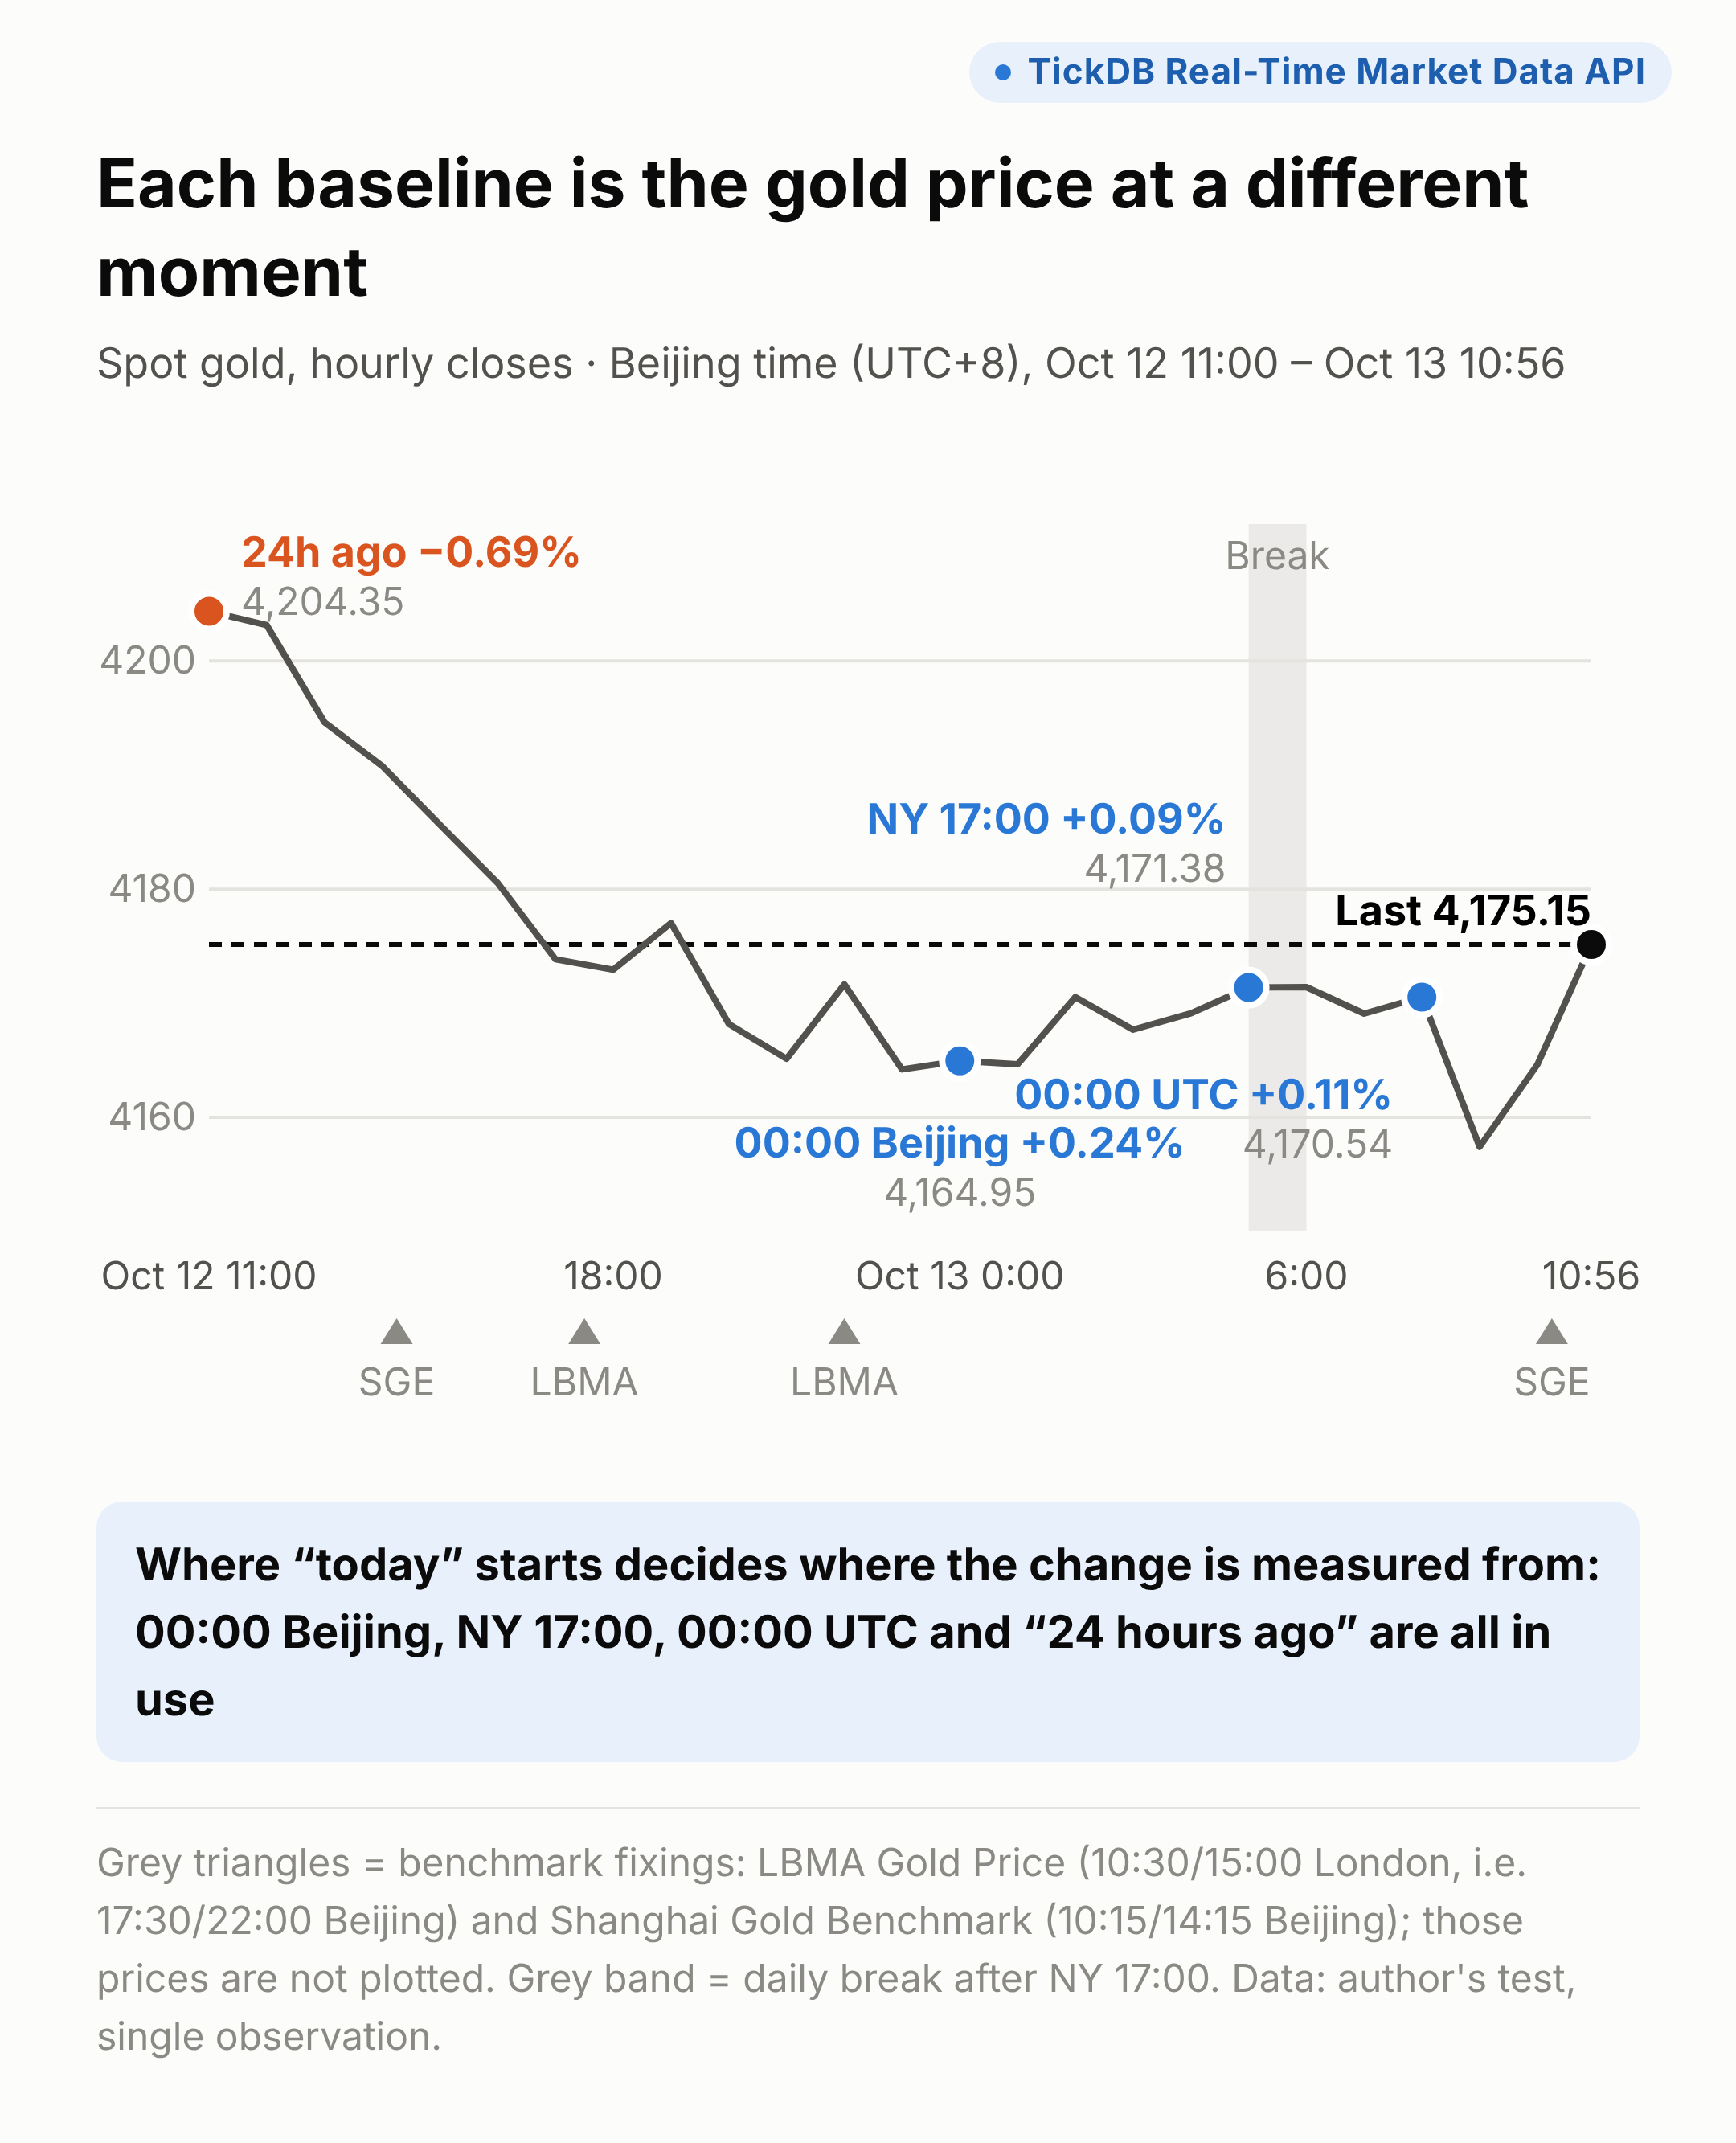
The root cause is that gold has no official close. The LBMA Gold Price is set twice a day (10:30 and 15:00 London time), the Shanghai Gold Benchmark twice a day (10:15 and 14:15 Beijing time), and COMEX futures settle on a volume-weighted average price near the close. Spot platforms aren't bound by any of these, so each picks its own moment to start the day. A CME article published on September 29, 2026 describes the hour after 17:00 New York as the administrative boundary of the global FX day — a common place to cut, but not the only one.
Where you cut can also produce surprises. A source that cuts daily bars at 00:00 UTC turns the first few hours after Sunday's open into a "daily" bar of their own: in my test, gold's Sunday, October 11 bar traded only 8,813, versus more than 150,000 on the surrounding trading days. The "prior close" returned by the API I tested, 4,190.27, was exactly that Sunday stub's close — giving −0.36%, matching neither the New York 17:00 price nor Monday's close.
What it costs: a false trigger can push a user to sell or buy; a missed one fails to warn them at all. And support can't explain why "the other app alerted and yours didn't."
How to fix it: write the baseline into the alert rule — "down 0.5% versus New York 17:00" — so users see it when they set it, and treat the hours after Sunday's open separately rather than as a trading day.
Two caveats: a "New York 17:00 price" taken from hourly bars can differ from another vendor's New York close by a few tenths of a dollar, and "24 hours earlier" can only be taken at the nearest hour, so it's an approximation.
Ask your vendor: when do you start the day for gold and FX, and how do you handle the hours after Sunday's open?
Scenario 3 — Portfolio pages: the ex-date "30% overnight loss"
What users see: on the morning of May 8, a Cambricon holder opens the app and their position is worth about a third less. The top of the losers list is Cambricon, −36.70%.
What went wrong: May 8 was Cambricon's ex-dividend and ex-rights date. Its 2025 distribution paid CNY 1.50 in cash plus 0.49 bonus shares per share, with a record date of May 7. On an ex-date, China's exchanges measure % change not against yesterday's close but against an ex-rights reference price:
Reference price = (prior close − cash dividend) ÷ (1 + share increase ratio) = (1,868.00 − 1.50) ÷ 1.49 = CNY 1,252.68
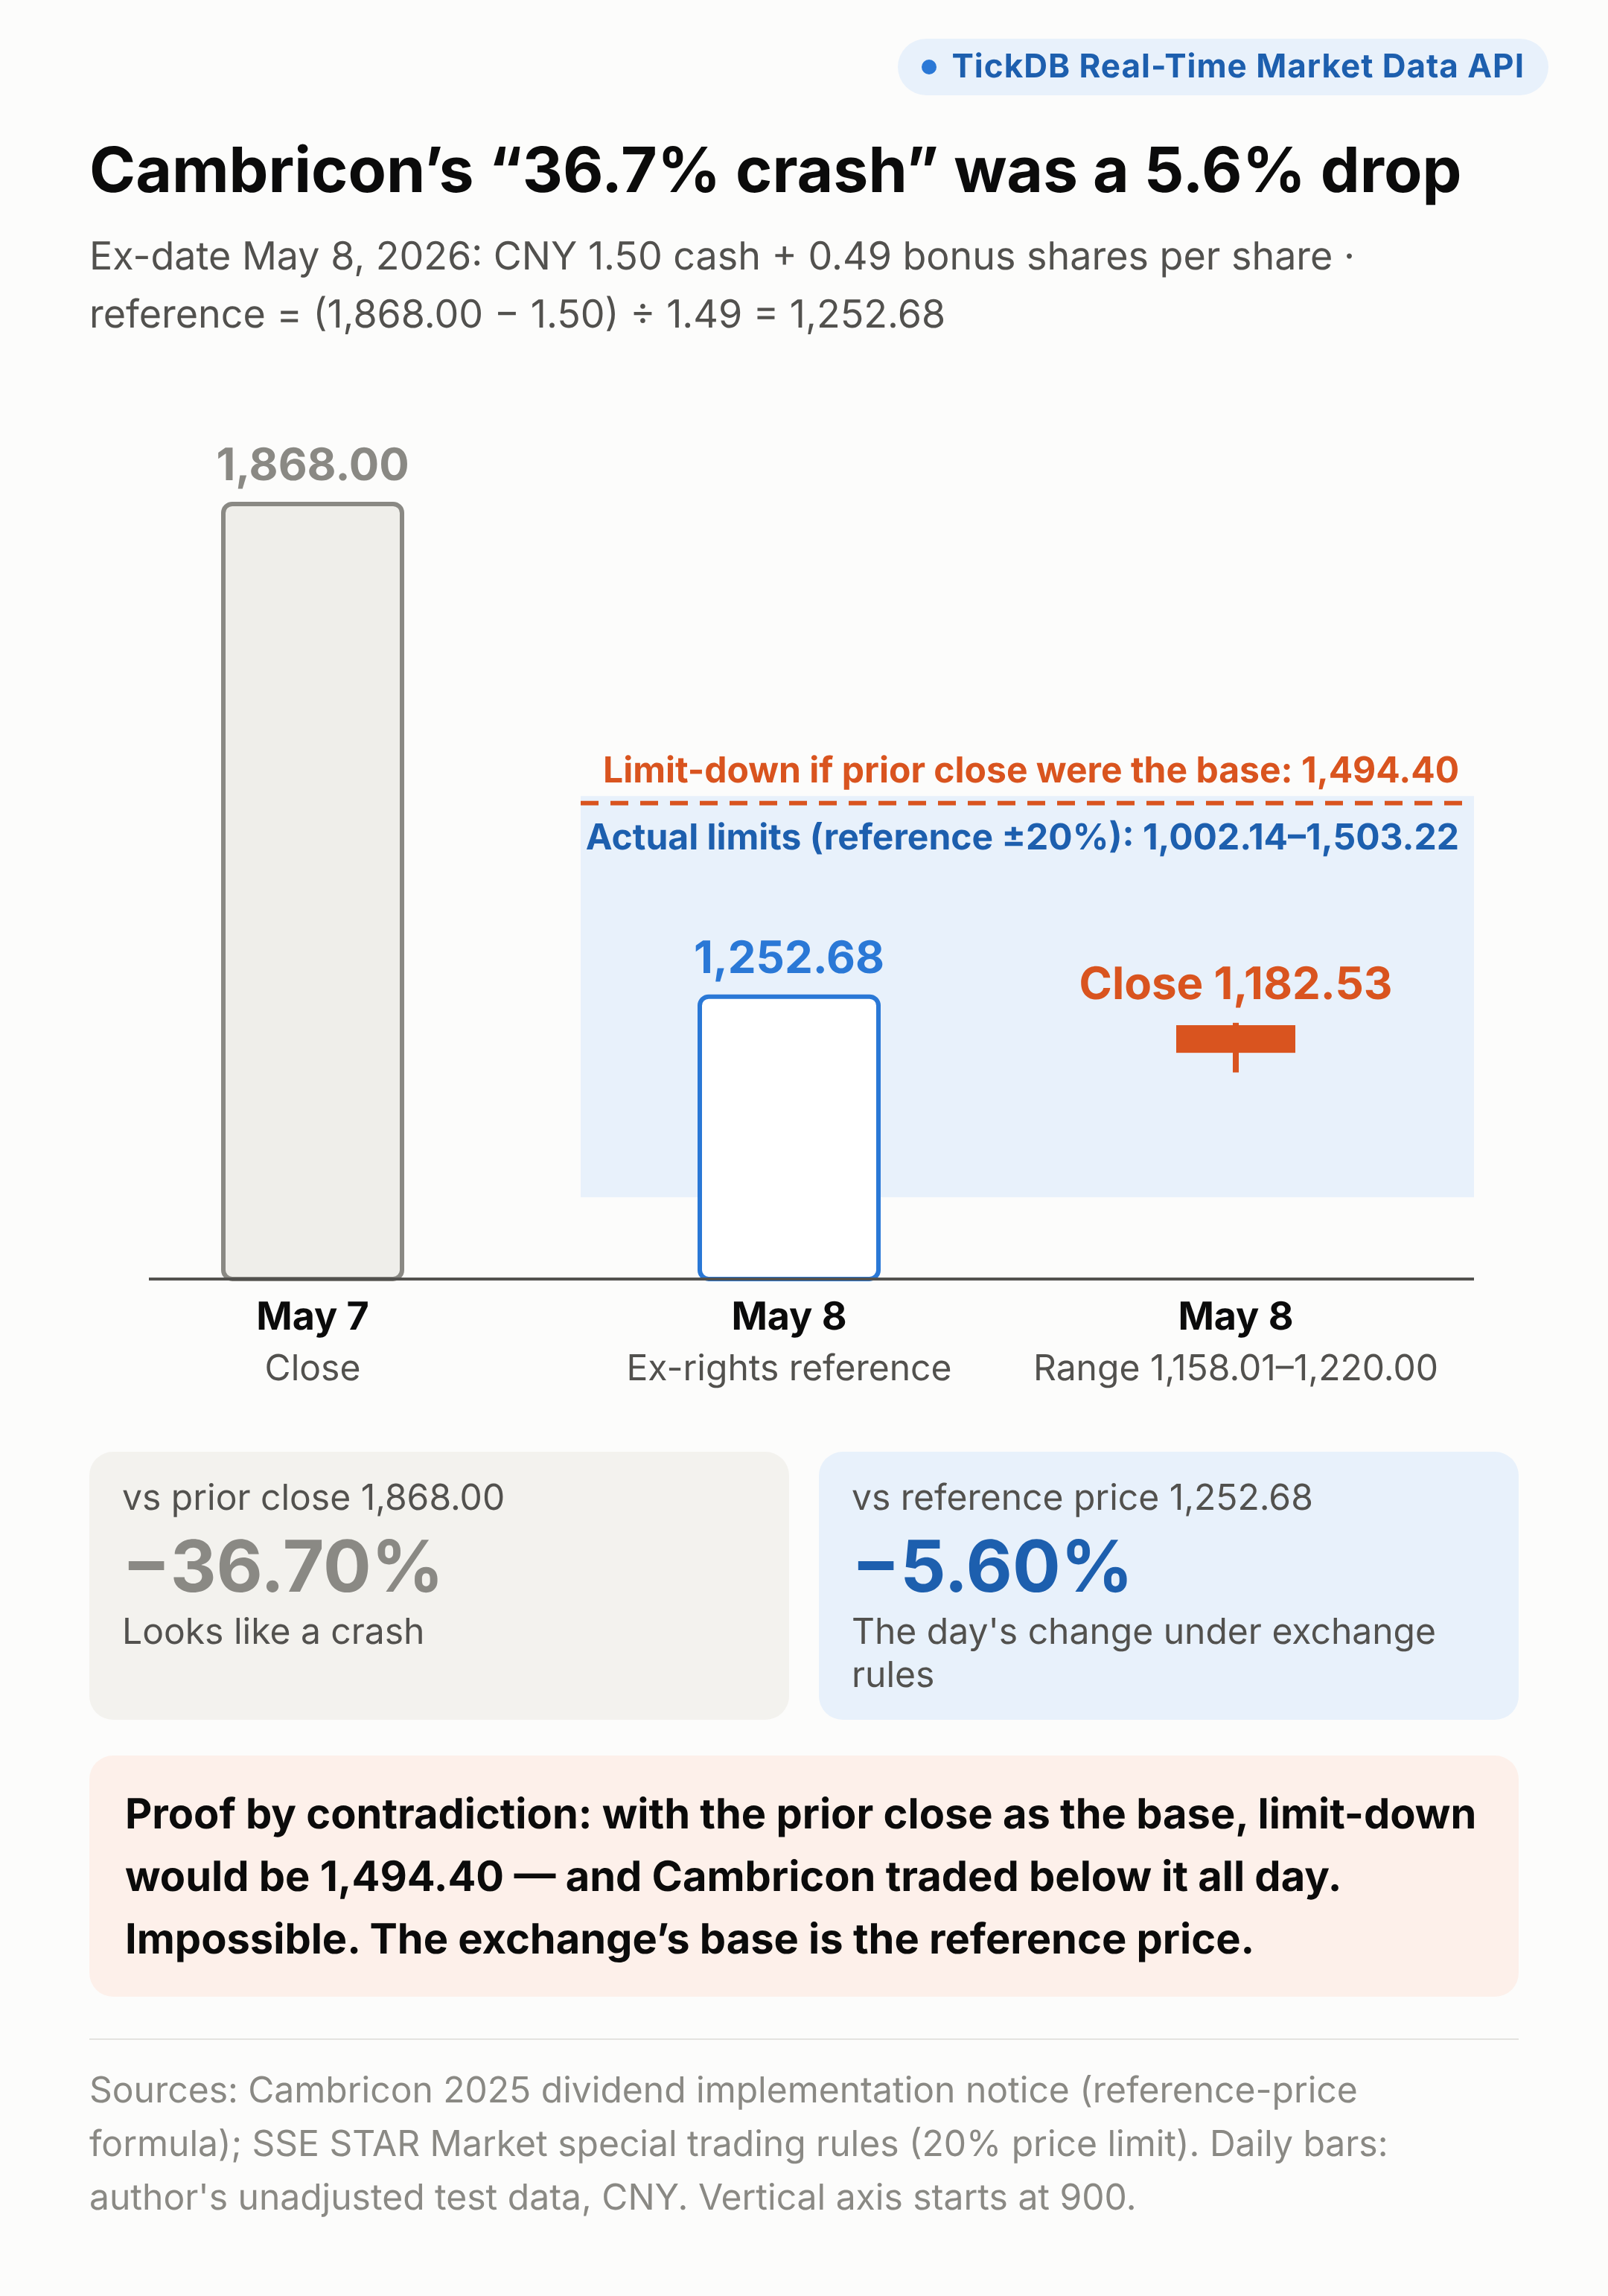
On May 8 Cambricon opened at CNY 1,217.03 and closed at 1,182.53:
- Against the prior close of 1,868.00: opened down 34.85%, closed down 36.70%
- Against the reference price of 1,252.68: opened down 2.85%, closed down 5.60%
The adjustment factor I pulled agrees: the forward adjustment factor for this event was 0.6706, and 1,868.00 × 0.6706 = 1,252.68.
There's also a proof by contradiction. Cambricon trades on the STAR Market, which has a 20% daily price limit. Against the reference price, the day's limits were CNY 1,002.14–1,503.22. If the base were the prior close, the limit-down price would have been 1,494.40 — yet Cambricon traded between 1,158.01 and 1,220.00 all day, which would mean trading below limit-down all session. Impossible. The exchange itself uses the reference price as the denominator.
What it costs: the holder now owns 1.49 times as many shares plus CNY 1.50 per share in cash, so the position didn't lose a third. But what they see is "down a third," and the first reaction is a screenshot to support. The losers list is wrong and operations has to explain it. Quants backtesting on unadjusted daily bars get a fake crash candle on that date, and stop-losses fire that never should have.
This isn't a once-a-year event. October is interim-dividend season in China; in the dividend calendar I pulled, October 12 and 13 alone had more than 20 A-share ex-dates.
How to fix it: when the snapshot's prior close differs sharply from yesterday's daily close, flag the ex-date, compute % change against the reference price and show the position with the new share count. Backtest on adjusted data.
Ask your vendor: on an ex-date, is the prior close you return the reference price?
Scenario 4 — Home screen versus detail page: one Apple, two changes
What users see: Apple is +1.29% on the home screen and +0.47% on the detail page. First reaction: the data is broken.
What went wrong: at 10:56 Beijing time on October 13, US stocks were in the overnight session. At that one moment, I found four changes for Apple:
- Main snapshot: $340.97 (Monday's regular close) versus Friday's close of 336.64: +1.29%
- After-hours: 341.36 versus Monday's close: +0.11%
- Overnight: 342.57 versus Monday's close: +0.47%
- Overnight versus Friday's close (my own calculation): +1.76%
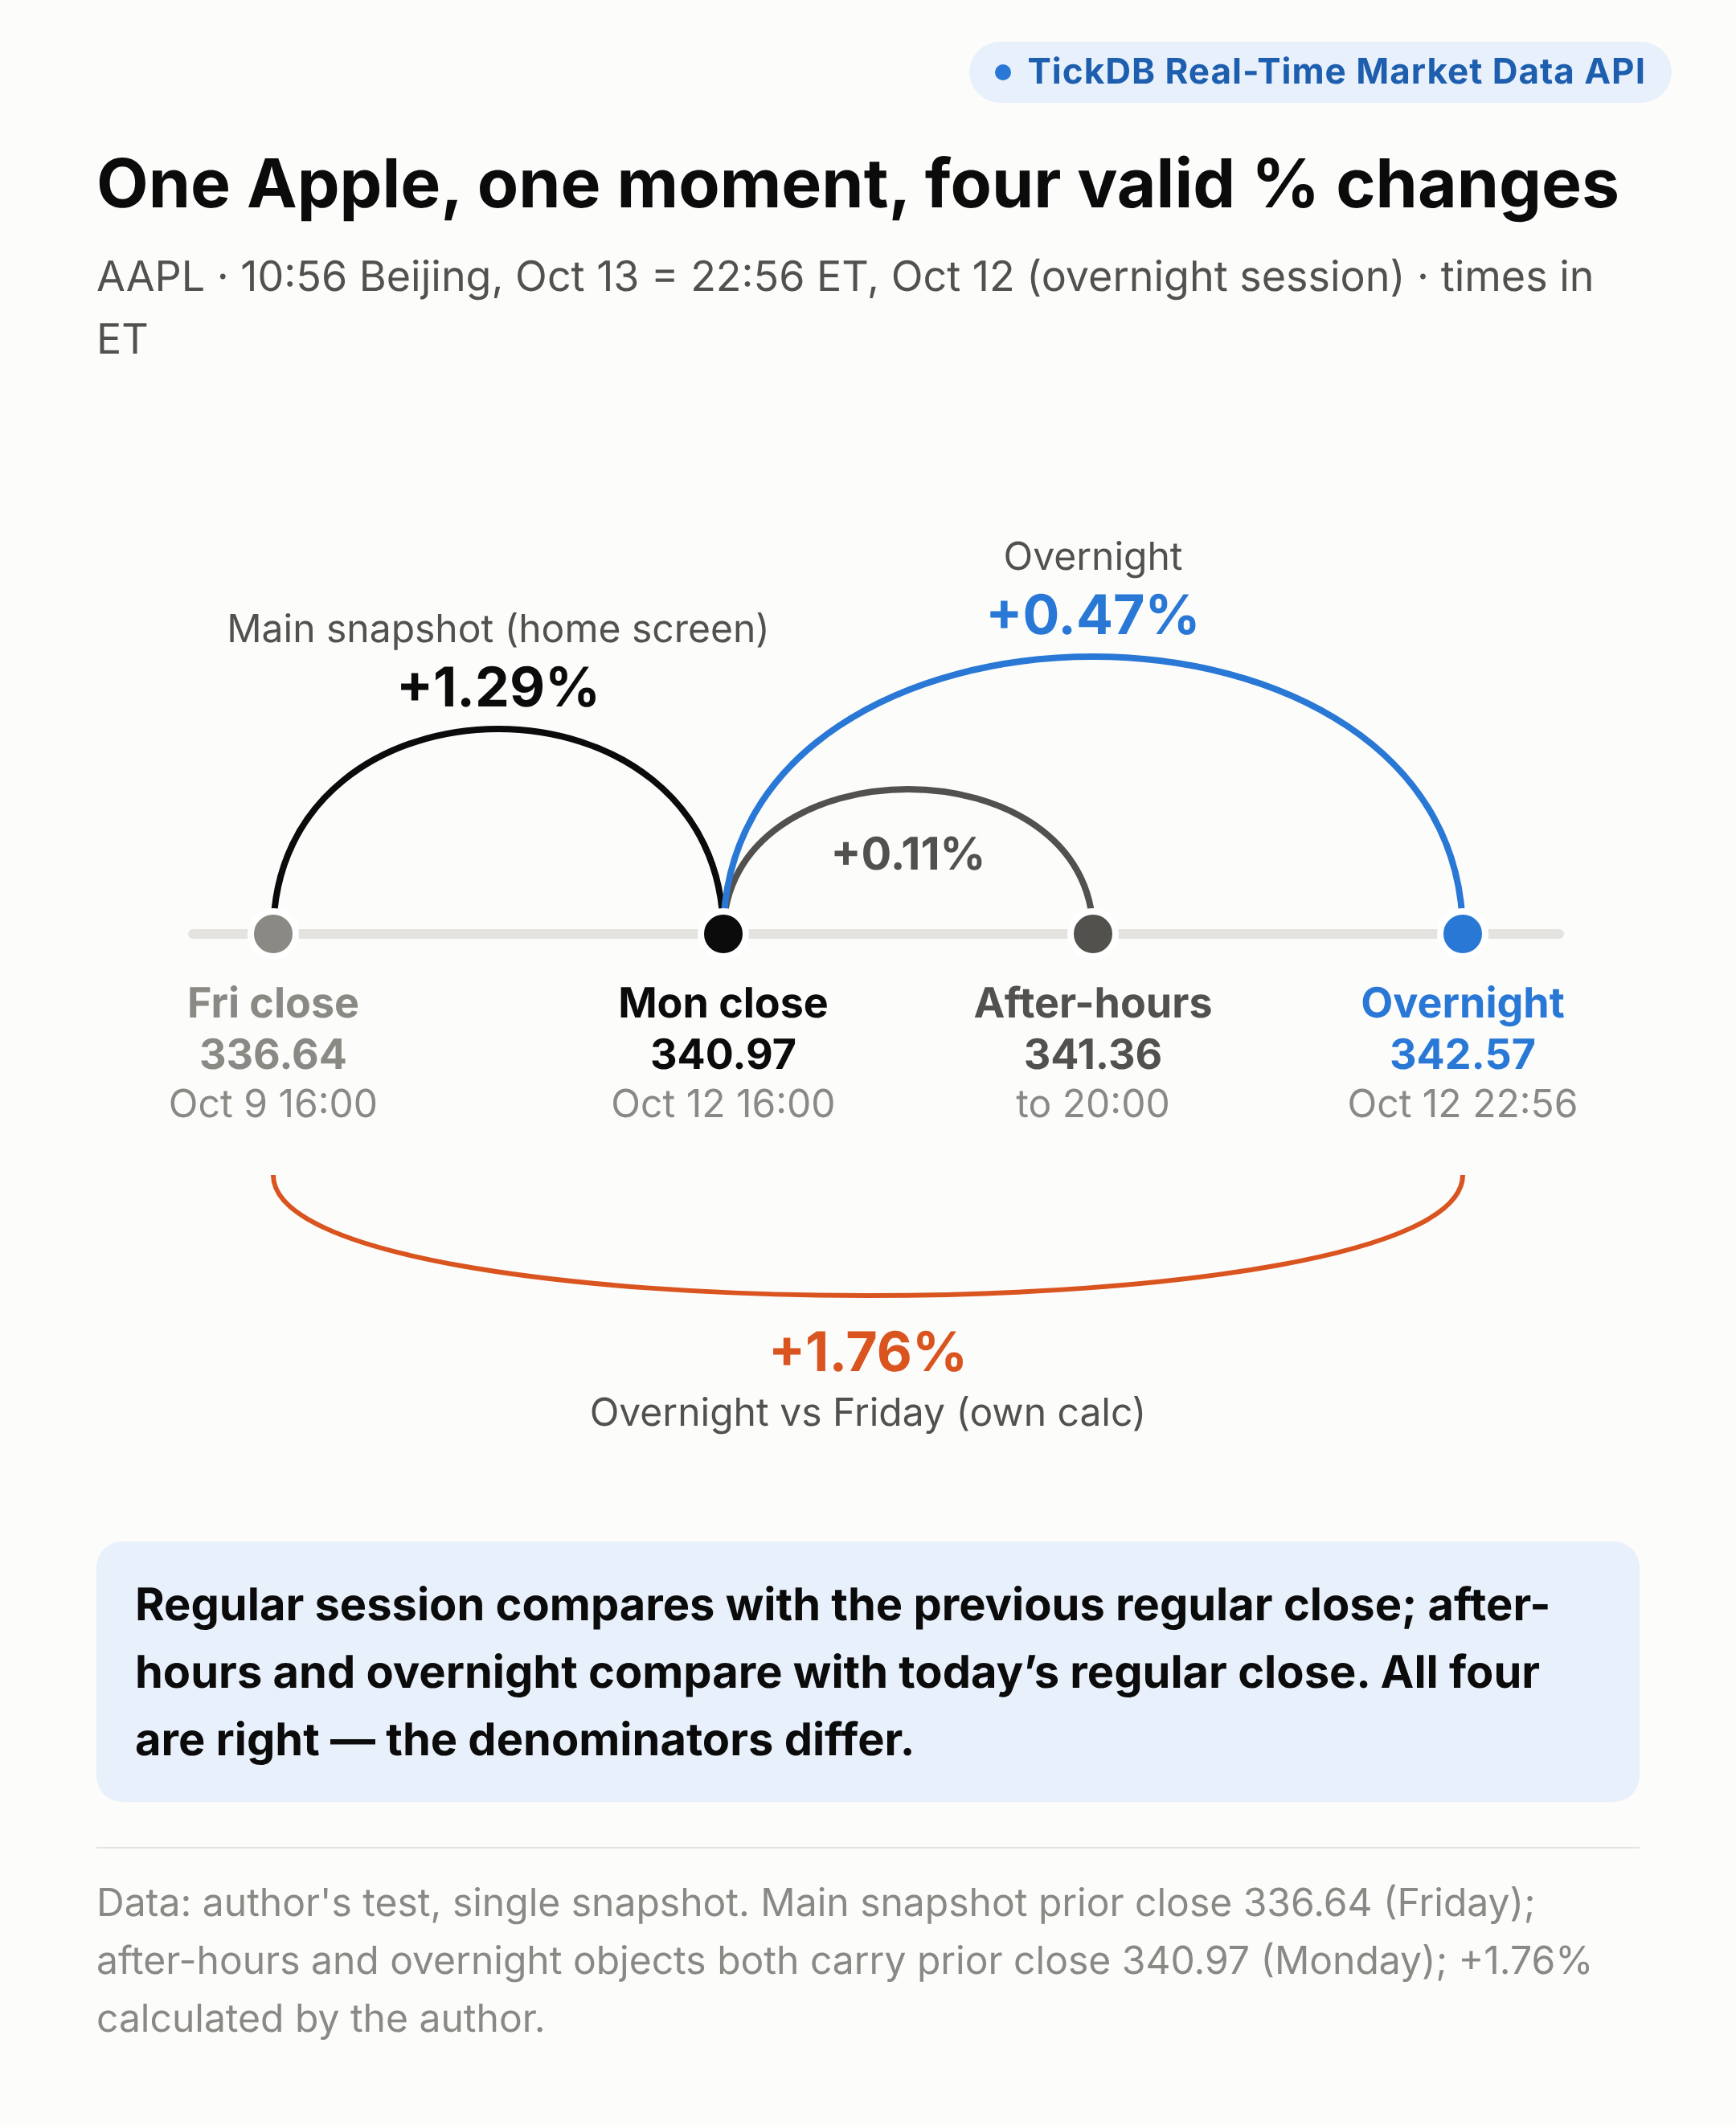
The rule: regular-session change compares with the previous regular close; after-hours and overnight compare with today's regular close. The data says so itself — the after-hours and overnight objects carry a prior close of 340.97 (Monday), the main snapshot 336.64 (Friday). All four numbers are right; the denominators differ.
What it costs: what users usually want to know is "how much is it up since Friday?" — that's +1.76%, and neither screen shows it. Two numbers side by side with no denominator lead users to one conclusion: this app's data can't be trusted. In earnings season, when after-hours gaps of several percent are common, the gap between home and detail screens gets bigger (the next piece in this series covers that).
How to fix it: next to every % change on the same screen, show the session and baseline — for example "Overnight vs Mon close +0.47%."
Ask your vendor: which close do pre-market, after-hours and overnight changes use?
The four scenarios in one table:
| Scenario | What users see | What's wrong | What it costs | Fix |
|---|---|---|---|---|
| Gainers list | Apple first, Bitcoin last | Five changes, five time spans | Meaningless ranking; users chase the wrong thing | Recompute on one window, then rank |
| Price alert | One app alerts, one doesn't | Different day-start times for gold | False or missed triggers | Put the baseline in the rule |
| Portfolio page | "Down a third overnight" | Ex-date not using the reference price | Panic, complaints, broken backtests | Detect ex-dates; use the reference price |
| Home vs detail | +1.29% and +0.47% | Regular and overnight baselines differ | Users stop trusting the data | Label session and baseline on every change |
These four look like technical details, but they're product decisions. Kahneman and Tversky's prospect theory (1979) found that people judge gains and losses relative to a reference point rather than in absolute terms. The % change in a market data app is a reference point chosen for the user. At the same $4,175.15 gold price, a reference point 24 hours earlier makes users feel they lost; one at midnight Beijing makes them feel they gained. Whoever sets the denominator sets how users feel about their day — which is why the denominator belongs on the screen.
Part 3 — How to fix it: three steps to one denominator across markets
Label every % change with its baseline, recompute on a common window, and handle ex-dates separately.
1. A cross-market baseline checklist
| Market | Suggested baseline | What the screen should say |
|---|---|---|
| China A-shares | Previous close; reference price on ex-dates | "vs prior close (ex-date adjusted)" |
| Hong Kong | Previous close | "vs prior close" |
| US regular session | Previous regular-session close | "vs previous close" |
| US pre-market, after-hours, overnight | Today's regular-session close | "Overnight vs today's close" |
| Gold, FX | One chosen day-start time (e.g. NY 17:00), stated | "vs NY 17:00" |
| Crypto | Rolling 24 hours, or midnight in a stated time zone | "24h" or "vs 00:00 UTC" |
| Indices while closed | Previous session's change with its date, or "closed" | "Oct 12 close" |
With this table, every % change can say what it's compared with. The A-share reference price follows exchange rules; the rest are recommendations.
2. Three steps
Step one is labeling. Attach a baseline price and baseline time to every % change. Without labels, users compare two apps, see different colors and ask; you explain once, and the next user asks again.
Step two is a common window. For anything that compares across markets — gainers lists, asset overviews, cross-market alerts — don't compare ready-made percentages. Recompute from bars on the same window. Otherwise the ranking depends on whose denominator is oldest.
Step three handles dividend dates. For China A-shares, first check whether today is an ex-date: if the snapshot's prior close differs sharply from yesterday's daily close, use the reference price or adjusted data.
3. Why cross-market is harder: six asset classes, six rule sets
If you only cover China A-shares, remembering "prior close and ex-dates" is enough. Cross-market, you manage six rule sets at once: A-share ex-dates, Hong Kong's closing auction, four US sessions, day-start times for gold and FX, crypto's rolling window and how indices display while closed.
Wire one vendor per market and a field called "prior close" can differ in name, timestamp format and day-start time from source to source. Before you can unify the denominator, you need a translation layer, and it gets thicker with every market you add. The rules keep moving too: when US daylight saving time ends on November 1, New York 17:00 moves from 05:00 to 06:00 Beijing time, and every source has to be re-checked.
So the low-maintenance way to build a cross-market data app is one API for every market's snapshots, bars and adjustment data, with the baseline-labeling layer written once.
4. I ran all six asset classes through one API
TickDB provides a unified global market data API for developers and AI applications, giving teams real-time and historical data across major markets — including US, Hong Kong and China A-shares — through a single integration, so they can ship market data, analytics and monitoring products faster.
Every number in this piece for Cambricon, Apple, gold, Bitcoin and the S&P 500 came from that one interface:
| What it does | What you still own |
|---|---|
| Snapshots for six asset classes (China A-shares, Hong Kong, US, FX and metals, indices, crypto) return last price, prior close and timestamp in the same fields | The API's % change is a ready-made number with no baseline label; you add the label |
| One bar endpoint across markets, so you can recompute against any baseline time (NY 17:00, 00:00 Beijing, 00:00 UTC) | For instruments with no official close, like gold and FX, recompute against a baseline you choose and display |
| US snapshots also carry after-hours and overnight prices with their own prior close; adjustment factors reproduce Cambricon's ex-rights reference price | Adjusted history changes after new corporate actions; record query time and adjustment mode for backtests |
Left: what one API supports directly. Right: product judgment no data source can make for you. Author's tests, October 12–13, 2026.
5. For your engineers: one snippet
If you don't write code, skip this section. The snippet does two things: recomputes gold's change against four baseline times using hourly bars, and flags China A-share ex-dates.
# Tested with Python 3.11
# Endpoints and field names checked against live calls on 2026-10-13
import os
import sys
from datetime import datetime, timedelta, timezone
from decimal import Decimal
from zoneinfo import ZoneInfo

import requests

API_KEY = os.getenv("TICKDB_API_KEY")       # read from an env var; never ship it to the front end
BASE_URL = "https://api.tickdb.ai/v1/market"
UTC, BJ, NY = timezone.utc, ZoneInfo("Asia/Shanghai"), ZoneInfo("America/New_York")
HOUR_MS = 3_600_000


def get(path, **params):
    """Call the API and check both the HTTP status and the API return code."""
    try:
        resp = requests.get(f"{BASE_URL}/{path}", params=params,
                            headers={"X-API-Key": API_KEY}, timeout=10)
        body = resp.json()
    except (requests.RequestException, ValueError) as e:
        raise RuntimeError(f"{path} request failed: {e}") from e
    if resp.status_code != 200 or body.get("code") != 0:
        raise RuntimeError(f"{path}: HTTP {resp.status_code}, code={body.get('code')}, {body.get('message')}")
    return body["data"]


def pct(last, base):
    """% change = (last - baseline) / baseline * 100."""
    last, base = Decimal(str(last)), Decimal(str(base))
    return (last - base) / base * 100


def price_at(hourly, moment):
    """Price at a moment = close of the hourly bar that ends at that moment (bar timestamps mark the start of the hour)."""
    target = int(moment.timestamp() * 1000) - HOUR_MS
    for bar in hourly:
        if bar["time"] == target:
            return bar["close"]
    return None


def last_moment(now, tz, hour):
    """Most recent `hour` o'clock in time zone `tz` before `now` (DST handled)."""
    local = now.astimezone(tz)
    m = local.replace(hour=hour, minute=0, second=0, microsecond=0)
    if m > local:
        m -= timedelta(days=1)
    return m


def gold_changes(symbol="XAUUSD"):
    """One last price, four self-chosen baselines."""
    q = get("ticker", symbols=symbol, type="forex")[0]
    hourly = get("kline", symbol=symbol, interval="1h", type="forex", limit=48)["klines"]
    now = datetime.fromtimestamp(q["timestamp"] / 1000, UTC)
    day_ago = (now - timedelta(hours=24) + timedelta(minutes=30)).replace(minute=0, second=0, microsecond=0)  # 24h ago, rounded to the nearest hour
    bases = {
        "24h ago (approx.)": price_at(hourly, day_ago),
        "NY 17:00": price_at(hourly, last_moment(now, NY, 17)),
        "00:00 UTC": price_at(hourly, last_moment(now, UTC, 0)),
        "00:00 Beijing": price_at(hourly, last_moment(now, BJ, 0)),
    }
    print(f"{symbol} last {q['last_price']} ({now.astimezone(BJ):%m-%d %H:%M} Beijing time)")
    for name, base in bases.items():
        print(f"  vs {name:<18} base {base}  change {pct(q['last_price'], base):+.2f}%" if base else f"  vs {name}: no data")


def is_ex_rights_day(prev_close, last_daily_close, tol=Decimal("0.005")):
    """If the snapshot prior close differs from the last daily close by more than 0.5%, it is probably an ex-date: check against the reference price or adjustment factors."""
    p, c = Decimal(str(prev_close)), Decimal(str(last_daily_close))
    return abs(p / c - 1) > tol


def check_ex_rights(symbol="688256.SH"):
    q = get("ticker", symbols=symbol, type="stock")[0]
    daily = get("kline", symbol=symbol, interval="1d", type="stock", limit=2)["klines"]
    yesterday_close = daily[-2]["close"]          # the last bar is today (may still be open), so take the one before it
    flag = is_ex_rights_day(q["prev_close"], yesterday_close)
    print(f"{symbol} snapshot prior close {q['prev_close']} / last daily close {yesterday_close} -> {'possible ex-date' if flag else 'normal'}")


if __name__ == "__main__":
    if not API_KEY:
        sys.exit("Set the TICKDB_API_KEY environment variable first")
    gold_changes()
    check_ex_rights()
    # Historical check: Cambricon ex-date 2026-05-08, reference 1252.68, prior close 1868.00
    print("2026-05-08 Cambricon:", "possible ex-date" if is_ex_rights_day("1252.68", "1868.00") else "normal")
Output on my data from 10:56 Beijing time, October 13:
XAUUSD last 4175.15 (10-13 10:56 Beijing time)
  vs 24h ago (approx.)  base 4204.35  change -0.69%
  vs NY 17:00           base 4171.38  change +0.09%
  vs 00:00 UTC          base 4170.54  change +0.11%
  vs 00:00 Beijing      base 4164.95  change +0.24%
688256.SH snapshot prior close 971.88 / last daily close 971.88 -> normal
2026-05-08 Cambricon: possible ex-date
Three notes:
- Every baseline comes from hourly bars. Bar timestamps mark the start of the hour, so the code takes the close of the bar that ends at the target moment.
- New York 17:00 is converted with a time-zone library, so daylight saving time is handled; the code needs no change after November 1.
- The 0.5% threshold is a rule of thumb that only flags candidates; confirm flagged dates against the reference price or adjustment factors.
6. Five questions for your data vendor
- What price is the baseline? Previous close, the price at a set time, or an adjusted reference price.
- What time and time zone does the baseline use? And how are the hours after Sunday's open handled? This decides whether gold, FX and crypto can sit next to stocks.
- Do you use the reference price after dividends and bonus shares? If not, portfolio pages will show "down a third overnight."
- Which close do changes outside regular hours use? Pre-market, after-hours and overnight each need a stated baseline, or home and detail screens won't match.
- What do you show when the market is closed? The previous session's change, or 0? Zero makes users think nothing moved.
FAQ
Why does the percent change in my market data app differ from another app?
Because the denominators differ. % change = (last − baseline) ÷ baseline. The last price is the same everywhere, but the baseline can differ: reference price or prior close on an A-share ex-date, NY 17:00 or 00:00 UTC for gold, rolling 24 hours or midnight for crypto, Monday's close or Friday's for a US stock overnight. Two apps showing different changes usually means different denominators, not a calculation error.
How do you rank percent changes across markets fairly?
Don't sort the ready-made % changes from different markets. Pick one window, such as "since 00:00 Beijing today" or "the past 24 hours," recompute every instrument from bars over that window, then rank. Show closed instruments separately.
What time is the gold closing price?
Spot gold has no official exchange close. The LBMA Gold Price is set at 10:30 and 15:00 London time; the Shanghai Gold Benchmark at 10:15 and 14:15 Beijing time; COMEX gold futures settle on a volume-weighted average price near the close. Spot platforms choose their own day-start, commonly NY 17:00, 00:00 UTC or 00:00 Beijing.
Why does a stock seem to crash after a dividend and bonus share payout?
On an ex-date, the baseline is the ex-rights reference price, not yesterday's close: (prior close − cash dividend) ÷ (1 + share increase ratio). Cambricon's prior close on May 8, 2026 was CNY 1,868.00; with CNY 1.50 cash and 0.49 bonus shares per share, the reference price was 1,252.68. A close of 1,182.53 looks like −36.7% but is −5.6% against the reference. The "missing" value became extra shares and cash.
What do US overnight changes compare with?
Today's regular-session close; regular-session changes use the previous regular close. At 10:56 Beijing time on October 13, 2026, Apple's main snapshot was up 1.29% versus Friday's close, while its overnight price was up 0.47% versus Monday's close. Show the main snapshot on the home screen and the overnight price on the detail page, and you get two different changes.
One last question
Where on your app does the % change say what it's compared with?
One thing you can do today: open your own gainers list and write next to each row what it's compared with and from what time. The row you can't fill in is your next support ticket.
If you just use trading apps, try this once: at the same moment, open three apps and note the same instrument's % change. If they differ, it's usually not an error — just three reference points.
Before you read a change, ask what it's compared with.
References
All accessed October 13, 2026.
- LBMA, LBMA Gold Price
- CME Group, When FX Futures Pause: Understanding spread risk around the daily close, September 29, 2026
- Shanghai Stock Exchange, notice on the closing call auction, August 6, 2018
- Nasdaq, Opening and Closing Cross FAQ
- HKEX, Trading Mechanism of CAS in the Securities Market
- Shanghai Gold Exchange, Shanghai Gold Benchmark Price Launching Ceremony, April 2016
- CME Group, Gold settlement procedure
- Cambricon, 2025 annual dividend implementation notice (notice no. 2026-011)
- Shanghai Stock Exchange, STAR Market special trading rules
- Binance, Spot API docs: 24hr Ticker Price Change Statistics
- Gate Help Center, How to switch the start/end time of the change
- Kahneman, D. & Tversky, A. (1979). Prospect Theory: An Analysis of Decision under Risk. Econometrica, 47(2), 263–291
- Previous piece in this series: Building a Multi-Market Stock Dashboard: 7 Things That Break After the Demo