How to Conduct an In-Depth Analysis of Hong Kong Stocks on AASTOCKS with 10-Level Order Book Depth and Tick-by-Tick Trades
TickDB Research ·
How to Conduct an In-Depth Analysis of Hong Kong Stocks on AASTOCKS with 10-Level Order Book Depth and Tick-by-Tick Trades
Abstract: After viewing Hong Kong stock quotes on AASTOCKS, if you want to assess the depth of the bid and ask sides, observe the pace of trading, or review price changes, you need to integrate order book depth and tick-by-tick records into a program. TickDB's Hong Kong stock order book supports up to ten levels on each side, while tick-by-tick queries return trade prices, quantities, directions, and timestamps and allow you to subscribe to real-time trades. This article uses depth imbalance and the volume-weighted average price of a trade sample to illustrate how these data can be used while distinguishing between the most recent trade window and historical data that can be queried by date.
Searching for aastock and opening AASTOCKS (阿思达克) to view Hong Kong stock quotes is a useful starting point for observing the market. But a single latest price cannot answer more detailed questions: How wide is the current spread between the bid and ask? How much volume remains at the levels behind the best bid? Was a price movement the result of one small trade or a burst of trading?
These questions require order book depth and tick-by-tick trades, respectively. TickDB's specific value for Hong Kong stocks lies in providing programs with up to ten levels of bid and ask prices and quantities, queryable tick-by-tick trade details, and real-time depth / trade pushes. This enables market observation to continue into calculations, alerts, and recordkeeping for subsequent review. This article focuses on these data uses. It does not treat AASTOCKS as a data source to be scraped or imply that the two companies have an API partnership.
10-Level Order Book Depth Turns Quotes into a Price Ladder
The latest traded price describes a completed transaction, while the order book describes the currently visible bid and ask quotes. Looking only at the best bid and best ask allows you to calculate the top-of-book spread. Looking further at bids 2 through 10 and asks 2 through 10 reveals whether orders near the market price are concentrated or whether there are significant differences in volume between levels.
The current Hong Kong stock depth documentation specifies up to ten levels per side. The REST response includes bids and asks, with each level containing a price and quantity; depth updates can also be received continuously through the WebSocket depth feed. Bids are arranged in descending price order, while asks are arranged in ascending price order. Here, "10 levels" is the maximum per side, and every response is not guaranteed to contain ten levels. Fewer levels may be returned when a level is empty, liquidity is insufficient, or the market is closed.
This enables two calculable observations. The first is the top-of-book spread, calculated by subtracting the best bid from the best ask. The second is the current visible depth imbalance, calculated as "the sum of quantities across bid levels minus the sum of quantities across ask levels," divided by the total quantity on both sides. When making comparisons, use a consistent range of levels and verify the quantity units. If only some levels are available, report the actual number of levels and do not label the result as a complete 10-level metric.
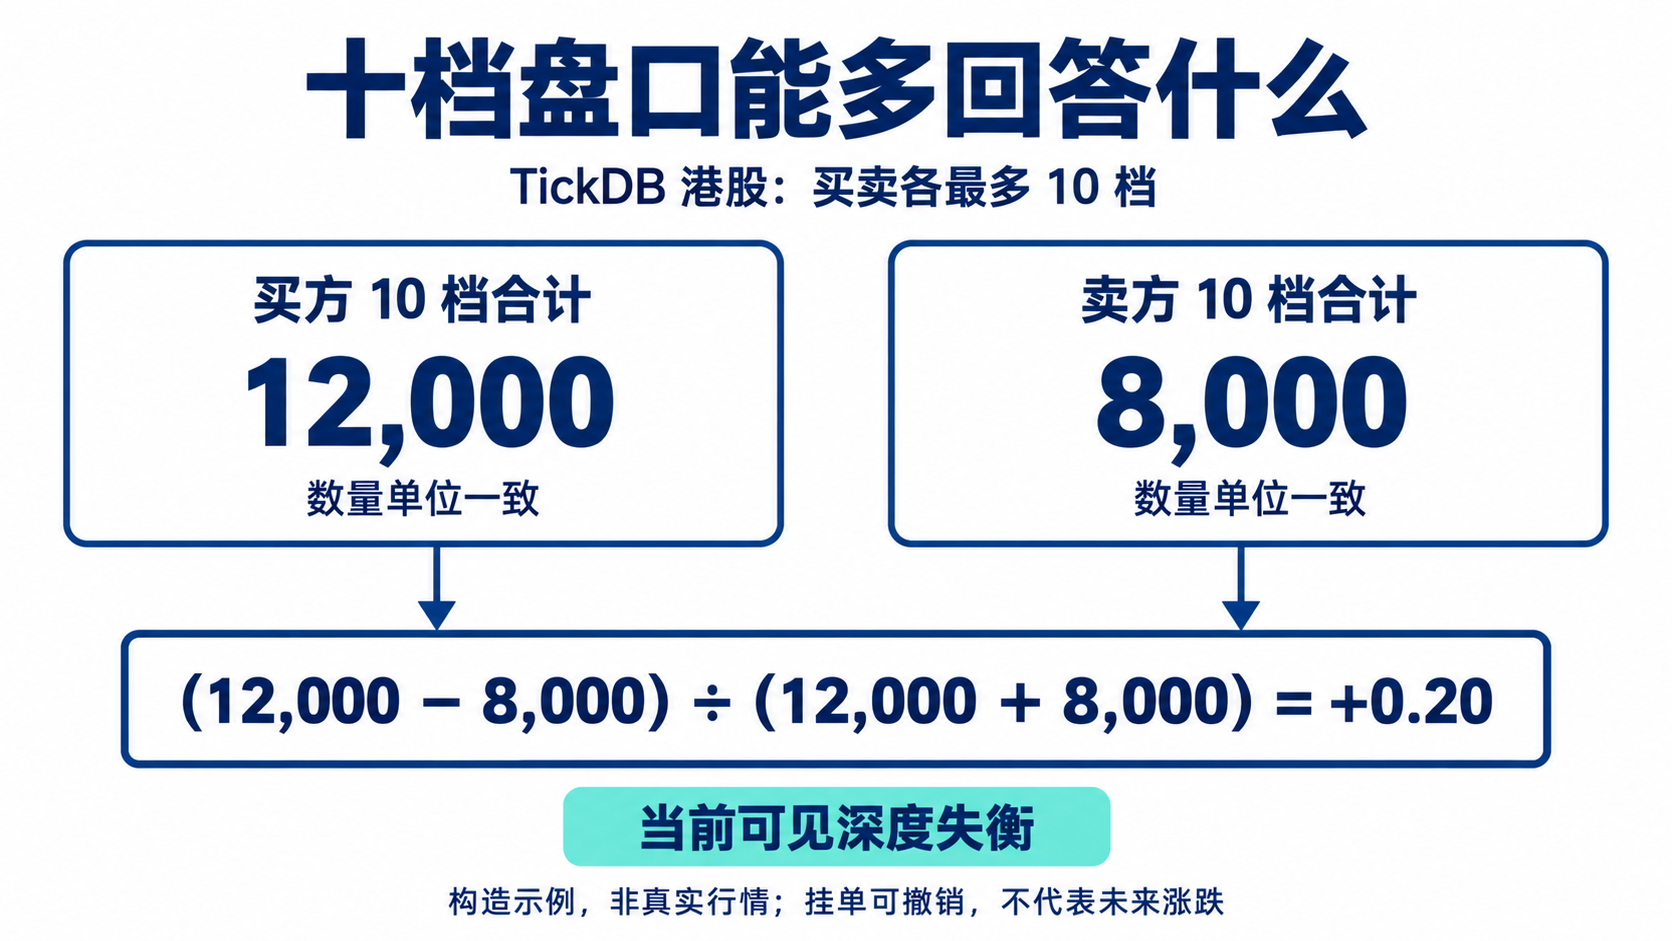
Figure 1: 10-level order book depth supports calculations across multiple order levels. The values are constructed examples and use consistent quantity units; they do not represent real-time quotes for any stock.
For example, if the total quantity across the ten bid levels is 12,000 and the total across the ask levels is 8,000, the imbalance is (12000−8000)/(12000+8000)=0.20. This indicates that more volume is visible on the buy side within the observed range and can serve as an input for monitoring order book changes. It does not mean the price will rise by 20%, nor does it prove that a large order will be filled. Orders can be canceled, and the 10-level order book does not expose individual order identities or the complete order queue.
It is also possible to estimate which visible price levels would be involved in filling a specified buy quantity by accumulating volume level by level from the best ask downward, under the assumption that "current resting orders remain unchanged." This is a static depth estimate and should not be treated as an actual execution price or a guarantee against slippage. Any quantity beyond the coverage of the returned levels should be marked as not estimable.
Tick-by-Tick Details Complete the Picture of Actual Trading
The order book answers "what is currently resting," while tick-by-tick trades answer "what actually traded." Hong Kong stock tick-by-tick records include a trade ID, price, quantity, direction, and millisecond timestamp. Programs can use these records to calculate the number of trades in a sample, the distribution of quantities, intervals between trades, and the volume-weighted average price, helping determine the trading activity behind a period of price movement.
A simple constructed sample contains three trades: price 100.00, quantity 100; price 100.20, quantity 200; and price 100.10, quantity 100. The sample's average price is (100×100+100.20×200+100.10×100)/400=100.125. This result describes only those three trades and should not be called the full-day average. Research should preserve both the earliest and latest timestamps in the sample to avoid mistaking "the most recent several trades" for "the most recent minute."
The direction field has three categories: buy, sell, and neutral. Quantities can be tallied separately for each category, but neutral trades should be retained, and direction labels should not be rewritten as "net institutional inflows." The trade direction classification itself does not reveal the identity of the trader; the specific classification methodology and quantity units still need to be verified.
The scope of historical tick-by-tick details must be distinguished carefully. The current public REST documentation supports querying trade records, with a default of 100 trades and a maximum of 1,000, and lists the parameters symbol, limit, and type. The verified materials do not specify parameters for querying multiple days of trades by start and end date, pagination methods, or the number of years for which tick-by-tick records are retained. Therefore, this article uses the feature to query recently completed trades and does not present it as a source for downloading complete tick-by-tick data for arbitrary historical dates.
If the goal is to conduct continuous reviews from this point forward, you can subscribe to the WebSocket trade feed and archive the data through the application. In the Hong Kong stock feed, trades are located in the data.trades array, and a single message may contain multiple trades, so it is not sufficient to retrieve only the first one. The queryable range of historical candlestick data also cannot be treated as the retention range for historical tick-by-tick data.
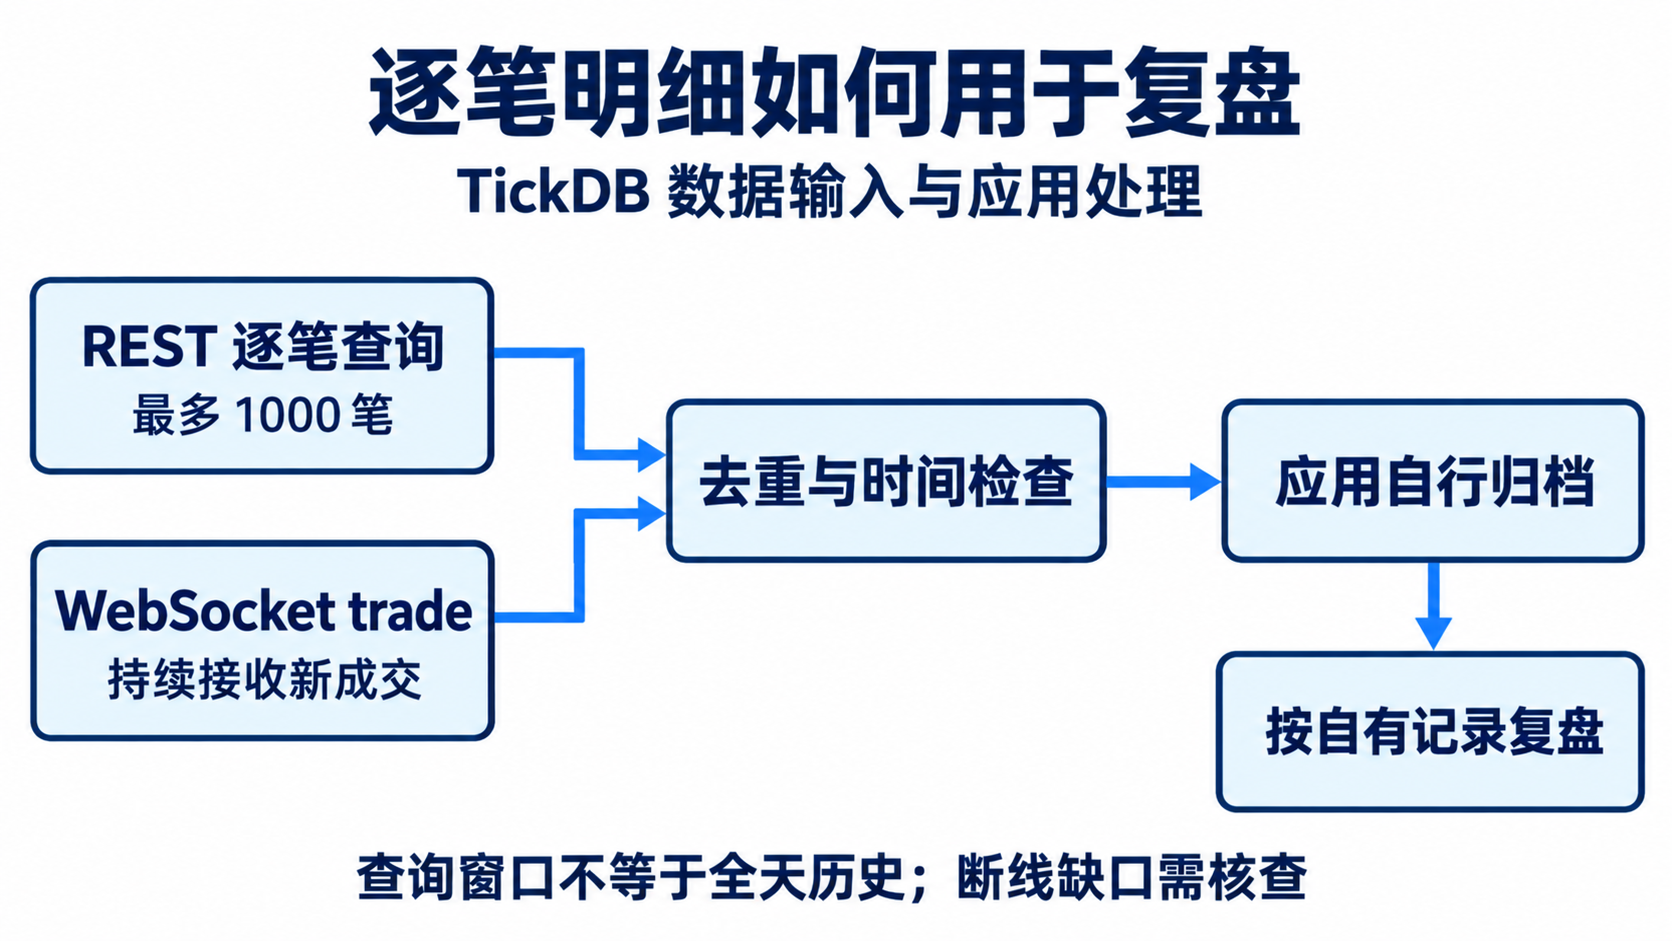
Figure 2: Tick-by-tick queries and real-time subscriptions can feed into the same review process. Archiving is an application-level capability, and gaps caused by disconnections still need to be checked.
Combining the Order Book with Trades Explains More Phenomena
Suppose the quantity at the best ask decreases. Looking at two order book snapshots alone cannot determine whether the order was filled or canceled. By adding trade records from adjacent periods, you can check whether corresponding trades occurred near that price level; if quote replenishment is also observed, you can study the pace at which orders are consumed and replenished. This involves comparing multiple pieces of evidence. A single change in quantity cannot establish that a particular participant is accumulating or distributing a position.
Care is needed to avoid temporal misuse here. Order book and trade data come from different messages or requests, so their original timestamps and local receipt times must be retained separately. Approximate alignment is possible only after confirming that their time semantics are comparable. Do not use the order book after a trade to infer the liquidity that was visible before that trade. When event sequences are missing or there are intervals between messages, approximate alignment must not be presented as exact reconstruction.
For Hong Kong stock dashboards, liquidity monitoring tools, and unusual-trading alerts, this is where structured market data interfaces become valuable: applications can store the latest price, order book state, and trade events for the same instrument separately, then perform calculations tailored to their own questions. This provides more analytical scope than simply displaying a price in an application. It does not imply that other AASTOCKS products lack equivalent functionality.
Query 10-Level Order Book Depth and Calculate Trade Sample Metrics
The Python 3 example below queries the order book depth and recent trades for 700.HK, then outputs the actual number of levels, spread, visible depth imbalance, number of trades, sample time range, and sample average price. The code uses only the standard library. Save it as hk_depth_trades.py and run it after setting TICKDB_API_KEY in the environment.
The current official entitlement table lists depth and trades as available on the Basic plan and above but unavailable on the Free plan; actual access still depends on account entitlements and instrument coverage. The program is not a matching engine and does not implement streaming archival.
import json
import os
from decimal import Decimal
from urllib.parse import urlencode
from urllib.request import Request, urlopen


def fetch(path, **params):
    url = "https://api.tickdb.ai/v1/market/" + path
    request = Request(url + "?" + urlencode(params), headers={
        "X-API-Key": os.environ["TICKDB_API_KEY"]
    })
    with urlopen(request, timeout=10) as response:
        body = json.load(response)
    if body.get("code") != 0:
        raise ValueError("API business error")
    return body["data"]


def positive(value):
    number = Decimal(str(value))
    if not number.is_finite() or number <= 0:
        raise ValueError("Invalid price or quantity")
    return number


def summarize(depth, tape):
    if depth["symbol"] != "700.HK" or tape["symbol"] != "700.HK":
        raise ValueError("Unexpected symbol")
    bids = [(positive(p), positive(q)) for p, q in depth["bids"]]
    asks = [(positive(p), positive(q)) for p, q in depth["asks"]]
    if not 0 < len(bids) <= 10 or not 0 < len(asks) <= 10:
        raise ValueError("Empty or unexpected depth")
    bid_qty = sum(q for p, q in bids)
    ask_qty = sum(q for p, q in asks)
    unique = {}
    for trade in tape["trades"]:
        key = (trade["id"], trade["timestamp"])
        if key in unique and unique[key] != trade:
            raise ValueError("Conflicting trade records")
        unique[key] = trade
    trades = list(unique.values())
    amounts = [(positive(t["price"]), positive(t["quantity"]))
               for t in trades]
    total = sum(q for p, q in amounts)
    vwap = sum(p * q for p, q in amounts) / total if total else None
    times = [t["timestamp"] for t in trades]
    return {
        "bid_levels": len(bids), "ask_levels": len(asks),
        "spread": str(min(p for p, q in asks) - max(p for p, q in bids)),
        "visible_depth_imbalance": str((bid_qty - ask_qty) / (bid_qty + ask_qty)),
        "depth_timestamp_ms": depth["timestamp"],
        "trade_count": len(trades),
        "trade_window_ms": [min(times), max(times)] if times else None,
        "sample_vwap": str(vwap) if vwap is not None else None,
    }


if __name__ == "__main__":
    depth = fetch("depth", symbol="700.HK", type="stock")
    tape = fetch("trades", symbol="700.HK", type="stock", limit=1000)
    print(json.dumps(summarize(depth, tape), indent=2))
This example deliberately preserves two separate sets of timestamps: the order book's depth_timestamp_ms and the trade sample's trade_window_ms. The two requests are executed sequentially and do not produce an atomic snapshot from the same moment. The code therefore calculates them independently and does not force them into a causal conclusion. sample_vwap is the volume-weighted average price of the returned records, while visible_depth_imbalance covers only the levels actually returned.
The example uses the combination of trade ID and timestamp to handle exact duplicate records within a single response and raises an error for conflicting records. This does not assume that trade IDs are unique across multiple days. Long-term archival should also verify the scope of ID uniqueness, preserve original records and their sources, and separately handle corrections, duplicate messages, and disconnection intervals. Invalid quantities, empty order books, and similar conditions cause errors; timestamp validity, market status, abnormal spreads, and account rate limits require additional handling in production applications.
The code and calculations in this article were validated offline using constructed samples. No authenticated online queries or continuous subscription tests were performed. The public documentation was verified on October 22, 2026, and the example values do not represent actual market data.
Validate Integration Against Analytical Tasks
When selecting a Hong Kong stock market data service, check whether the instruments being studied return the expected number of levels, whether tick-by-tick records contain the required fields, and how your own sample windows will be stored and reconstructed after subscribing. Requesting 1,000 trades does not mean that 1,000 trades will be returned, much less that they cover an entire trading day. Continuous subscription also does not automatically prove that no data is missing.
TickDB's advantage in the scenario described here is that it turns both the 10-level price ladder and the tick-by-tick trading process into calculable data inputs while providing two integration methods: querying and subscribing. For people seeking to move from routine market monitoring on AASTOCKS to independent analysis, this supports order book monitoring, trading-pace statistics, and review of proprietary records. When making a final selection, verify each requirement related to instrument coverage, entitlements, timeliness, and historical coverage.
Sources: AASTOCKS official website; TickDB Hong Kong stock market data overview, order book depth, tick-by-tick trades, and WebSocket depth / trade documentation. Date verified: October 22, 2026.