Pre-Market and After-Hours Quotes: Which % Change Should Your Trading App Show?
TickDB Research ·
At the same moment, Apple's percentage change can read +0.50%, +0.68% or +1.18%. None of them is wrong. Each one answers a different question. During earnings season, prices move most in pre-market and after-hours trading, and the gap between those answers widens. This post explains what each number means, and gives market data apps three display rules plus working Python code.
It's 6:24 a.m. Eastern on October 15. The US market won't open for another three hours, but pre-market trading is live. Open two stock apps and look at Apple: one says +1.18%, the other says +0.68%. Tap into the detail page and there's a third line: "Yesterday +0.50%".
Same stock, same moment, three numbers. So how much is Apple actually up?
The short answer: all three are correct. They're answering three different questions.
So "which percentage is right?" is the wrong question. The real question is: which question is your interface answering for the user, and does it say so?
This matters most over the next few weeks. Netflix reports after the close on October 20, Tesla and Meta on October 21, Alphabet and Microsoft on October 28, and Apple after the close on November 2. When results land, prices move hard outside regular hours, and those three numbers drift far apart.
Who this is for:
- Product managers and engineers building brokerage apps, market dashboards and watchlists: the quote card, top-movers list, price alerts and charts all run into this.
- Teams running push notifications and market recaps: which percentage goes into the alert?
- Anyone who checks US stocks outside market hours and wants to know what the number on screen means.
Sections 1–3 need no code. Section 4 is the part to forward to your engineers.
1. A percentage change is not a number, it's a question
A percentage change is a question: how far has the current price moved from some reference price? Pick the reference, and you've picked the question.
Most people assume "% change" means "how much is it up today", with one right answer. That mostly works for markets that only trade during the day. US stocks trade in sessions: pre-market, regular, after-hours, and now overnight. Each session has its own last price, so there's more than one reasonable baseline.
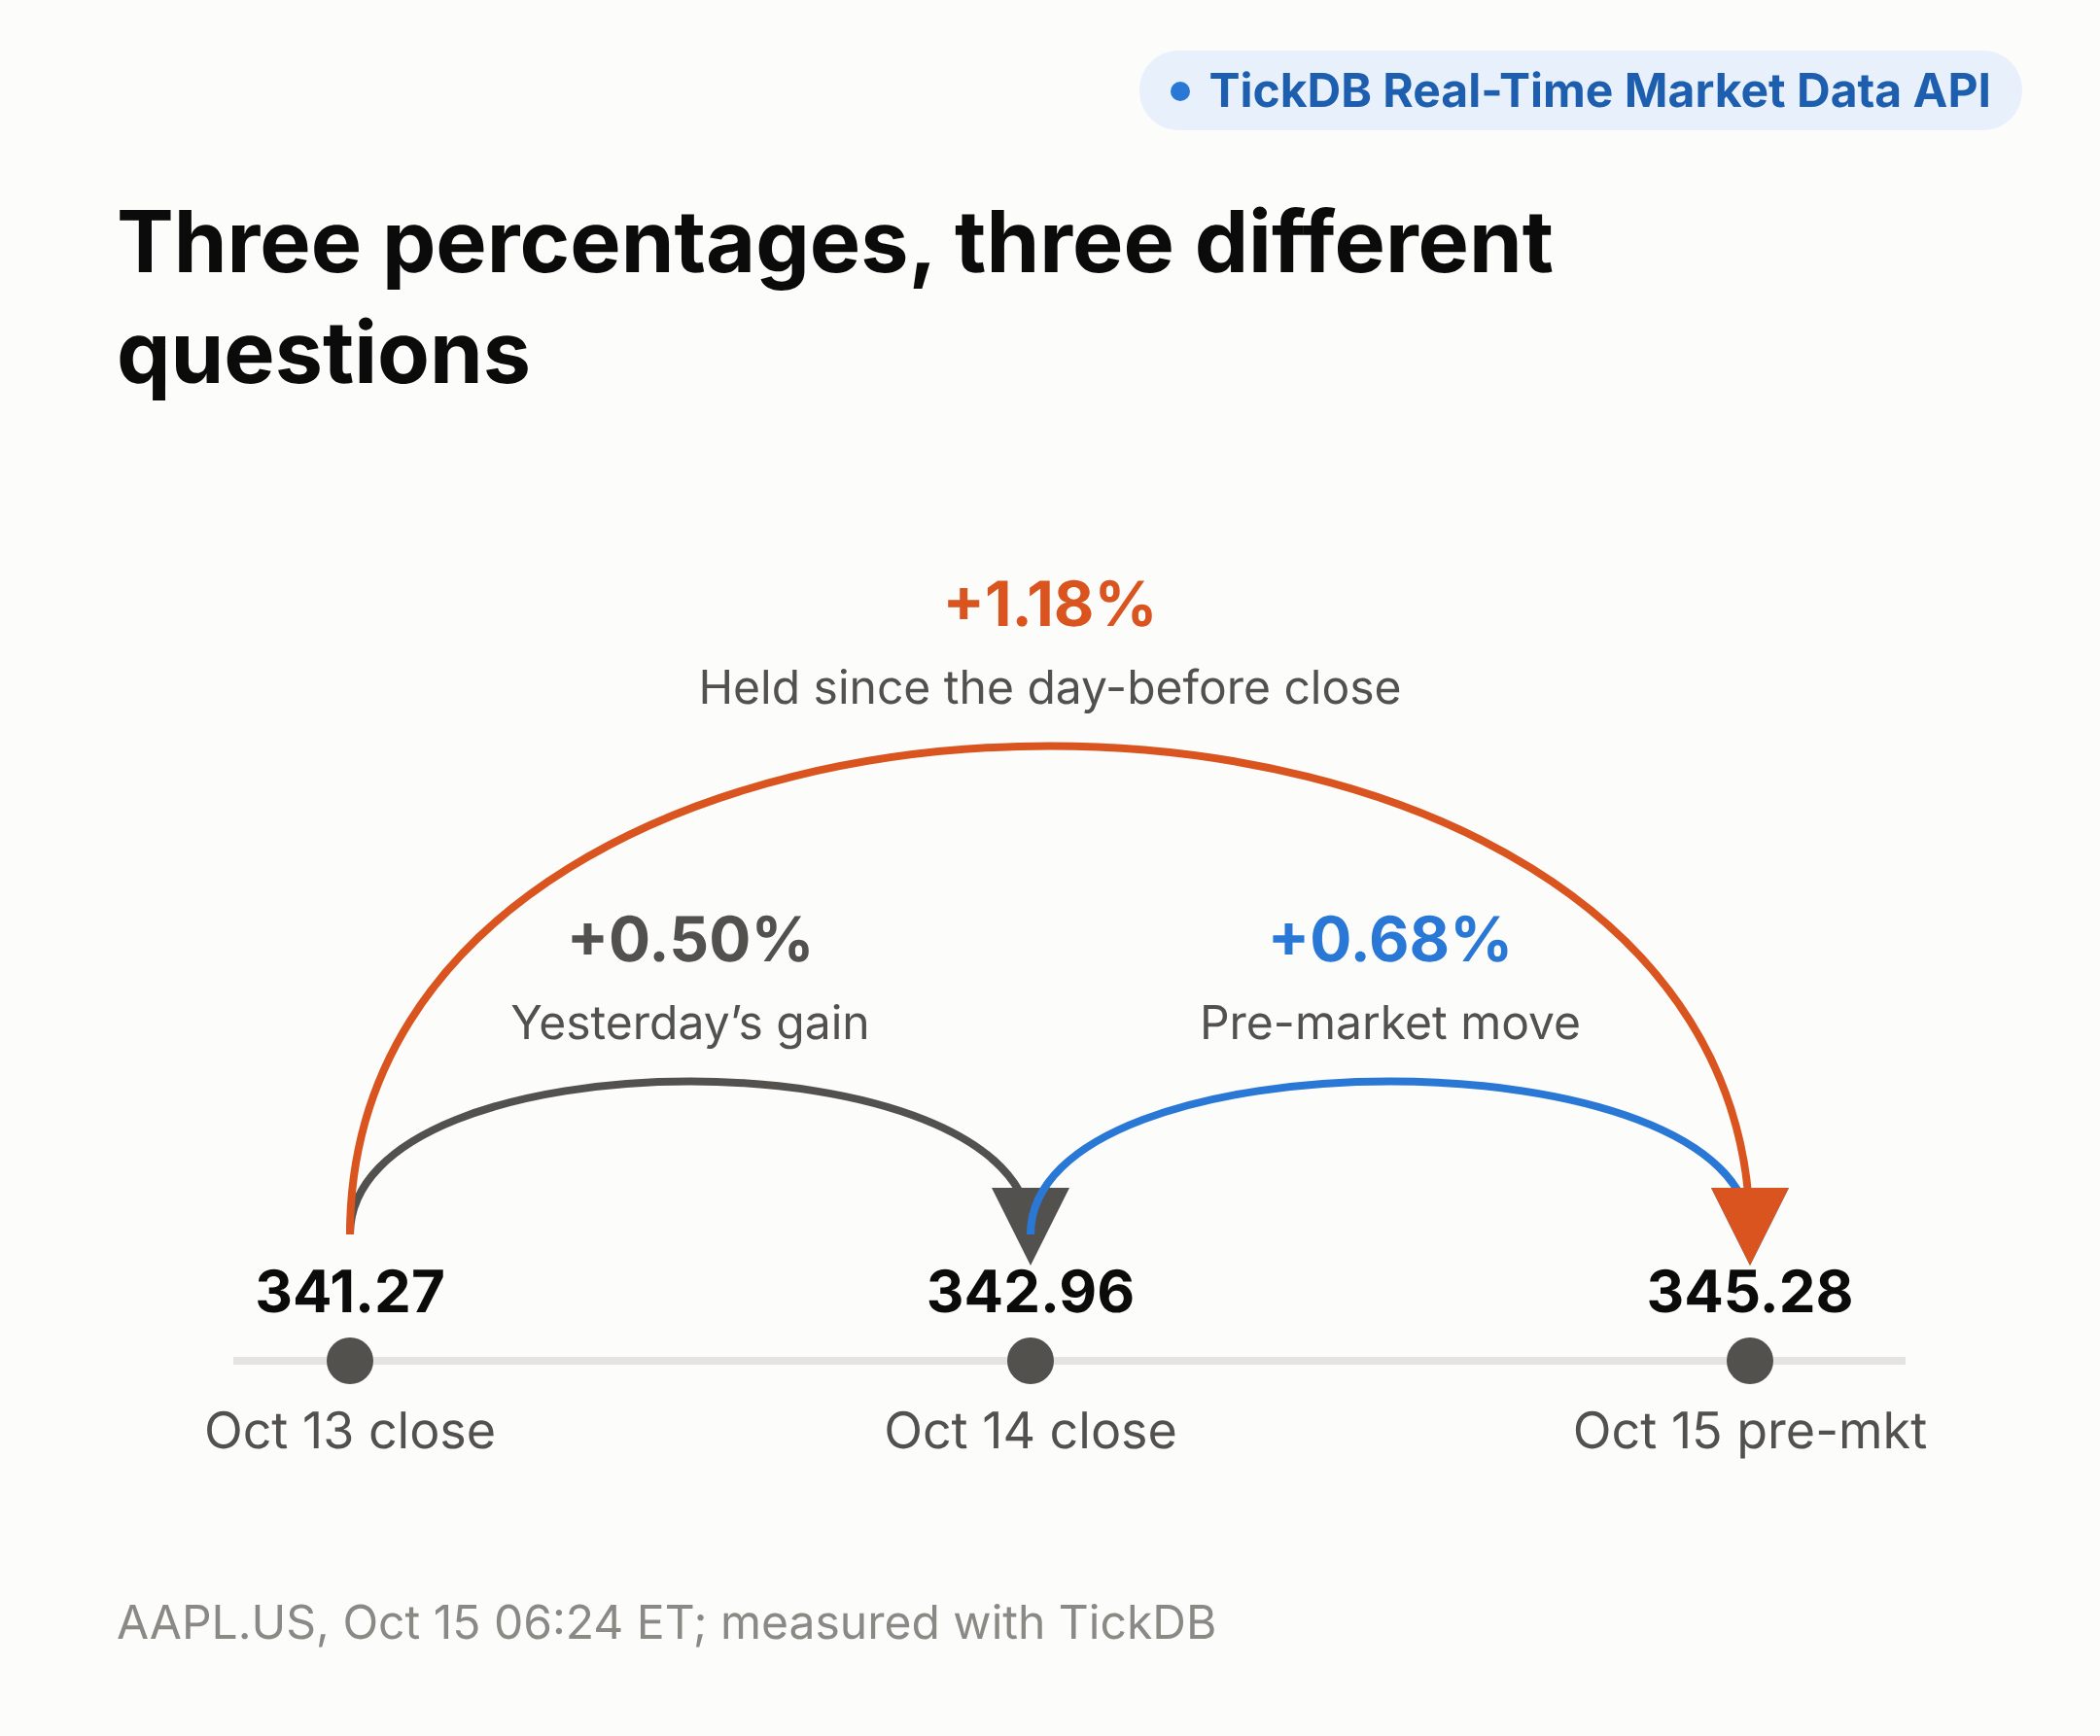
Here's what I measured for Apple at 6:24 a.m. ET on October 15:
- +0.50%: the October 14 regular close (342.96) versus the October 13 close (341.27). It answers how much did it gain yesterday.
- +0.68%: the pre-market price (345.28) versus the latest regular close, October 14's 342.96. It answers how much it has moved since the last close.
- +1.18%: the same pre-market price (345.28) versus the October 13 close (341.27). It answers how much is it up if you bought at the close two days ago.
The last two use the same current price. The only difference is the baseline: yesterday's close versus the close the day before.
So how does +1.18% end up labeled as "today's change"?
The culprit is when the previous close rolls over. I pulled quotes before and after the open on October 15. Before the open, the main quote's prev_close was still the October 13 close, 341.27. It only switched to 342.96 after the open. The pre-market, after-hours and overnight quotes used 342.96 the whole time.
In other words, for the hours before the bell, the main quote's previous close is two days old. Code that divides the pre-market price by that number gets +1.18%, and counts yesterday's 0.50% gain a second time.
That leads to a simple test: a percentage change is only usable if the screen can say two things next to it. Which session is the price from? Which day's close is the baseline? If it can't, users end up reading a "bought two days ago" number as "how much it moved this morning".
On a quiet day, extended-hours moves are small and the three numbers sit close together. Earnings season is different.
2. Earnings season makes the gap bigger
During earnings season, the big moves happen before the open and after the close. The three numbers spread out, and picking the wrong baseline costs more.
Why outside regular hours? Because that's when US companies release results. Exchange guidance to listed companies has long been to publish material news after the close: Nasdaq asks companies to wait until at least 4:01 p.m. ET, preferably 4:05, and the NYSE has advised 4:15. Netflix, Tesla and Apple all report after the close; JPMorgan reports before the open. The first reaction to earnings almost always happens off-hours.
Evidence 1: the move was over before the open
TSMC held its earnings call on October 15. Its US shares opened at 415.10 that day, 3.5% below the previous close of 430. But the drop didn't happen at the open. After-hours trading the night before printed 422.55, the overnight session 422.05, and the last pre-market price before the bell was 415.12, essentially the opening price.
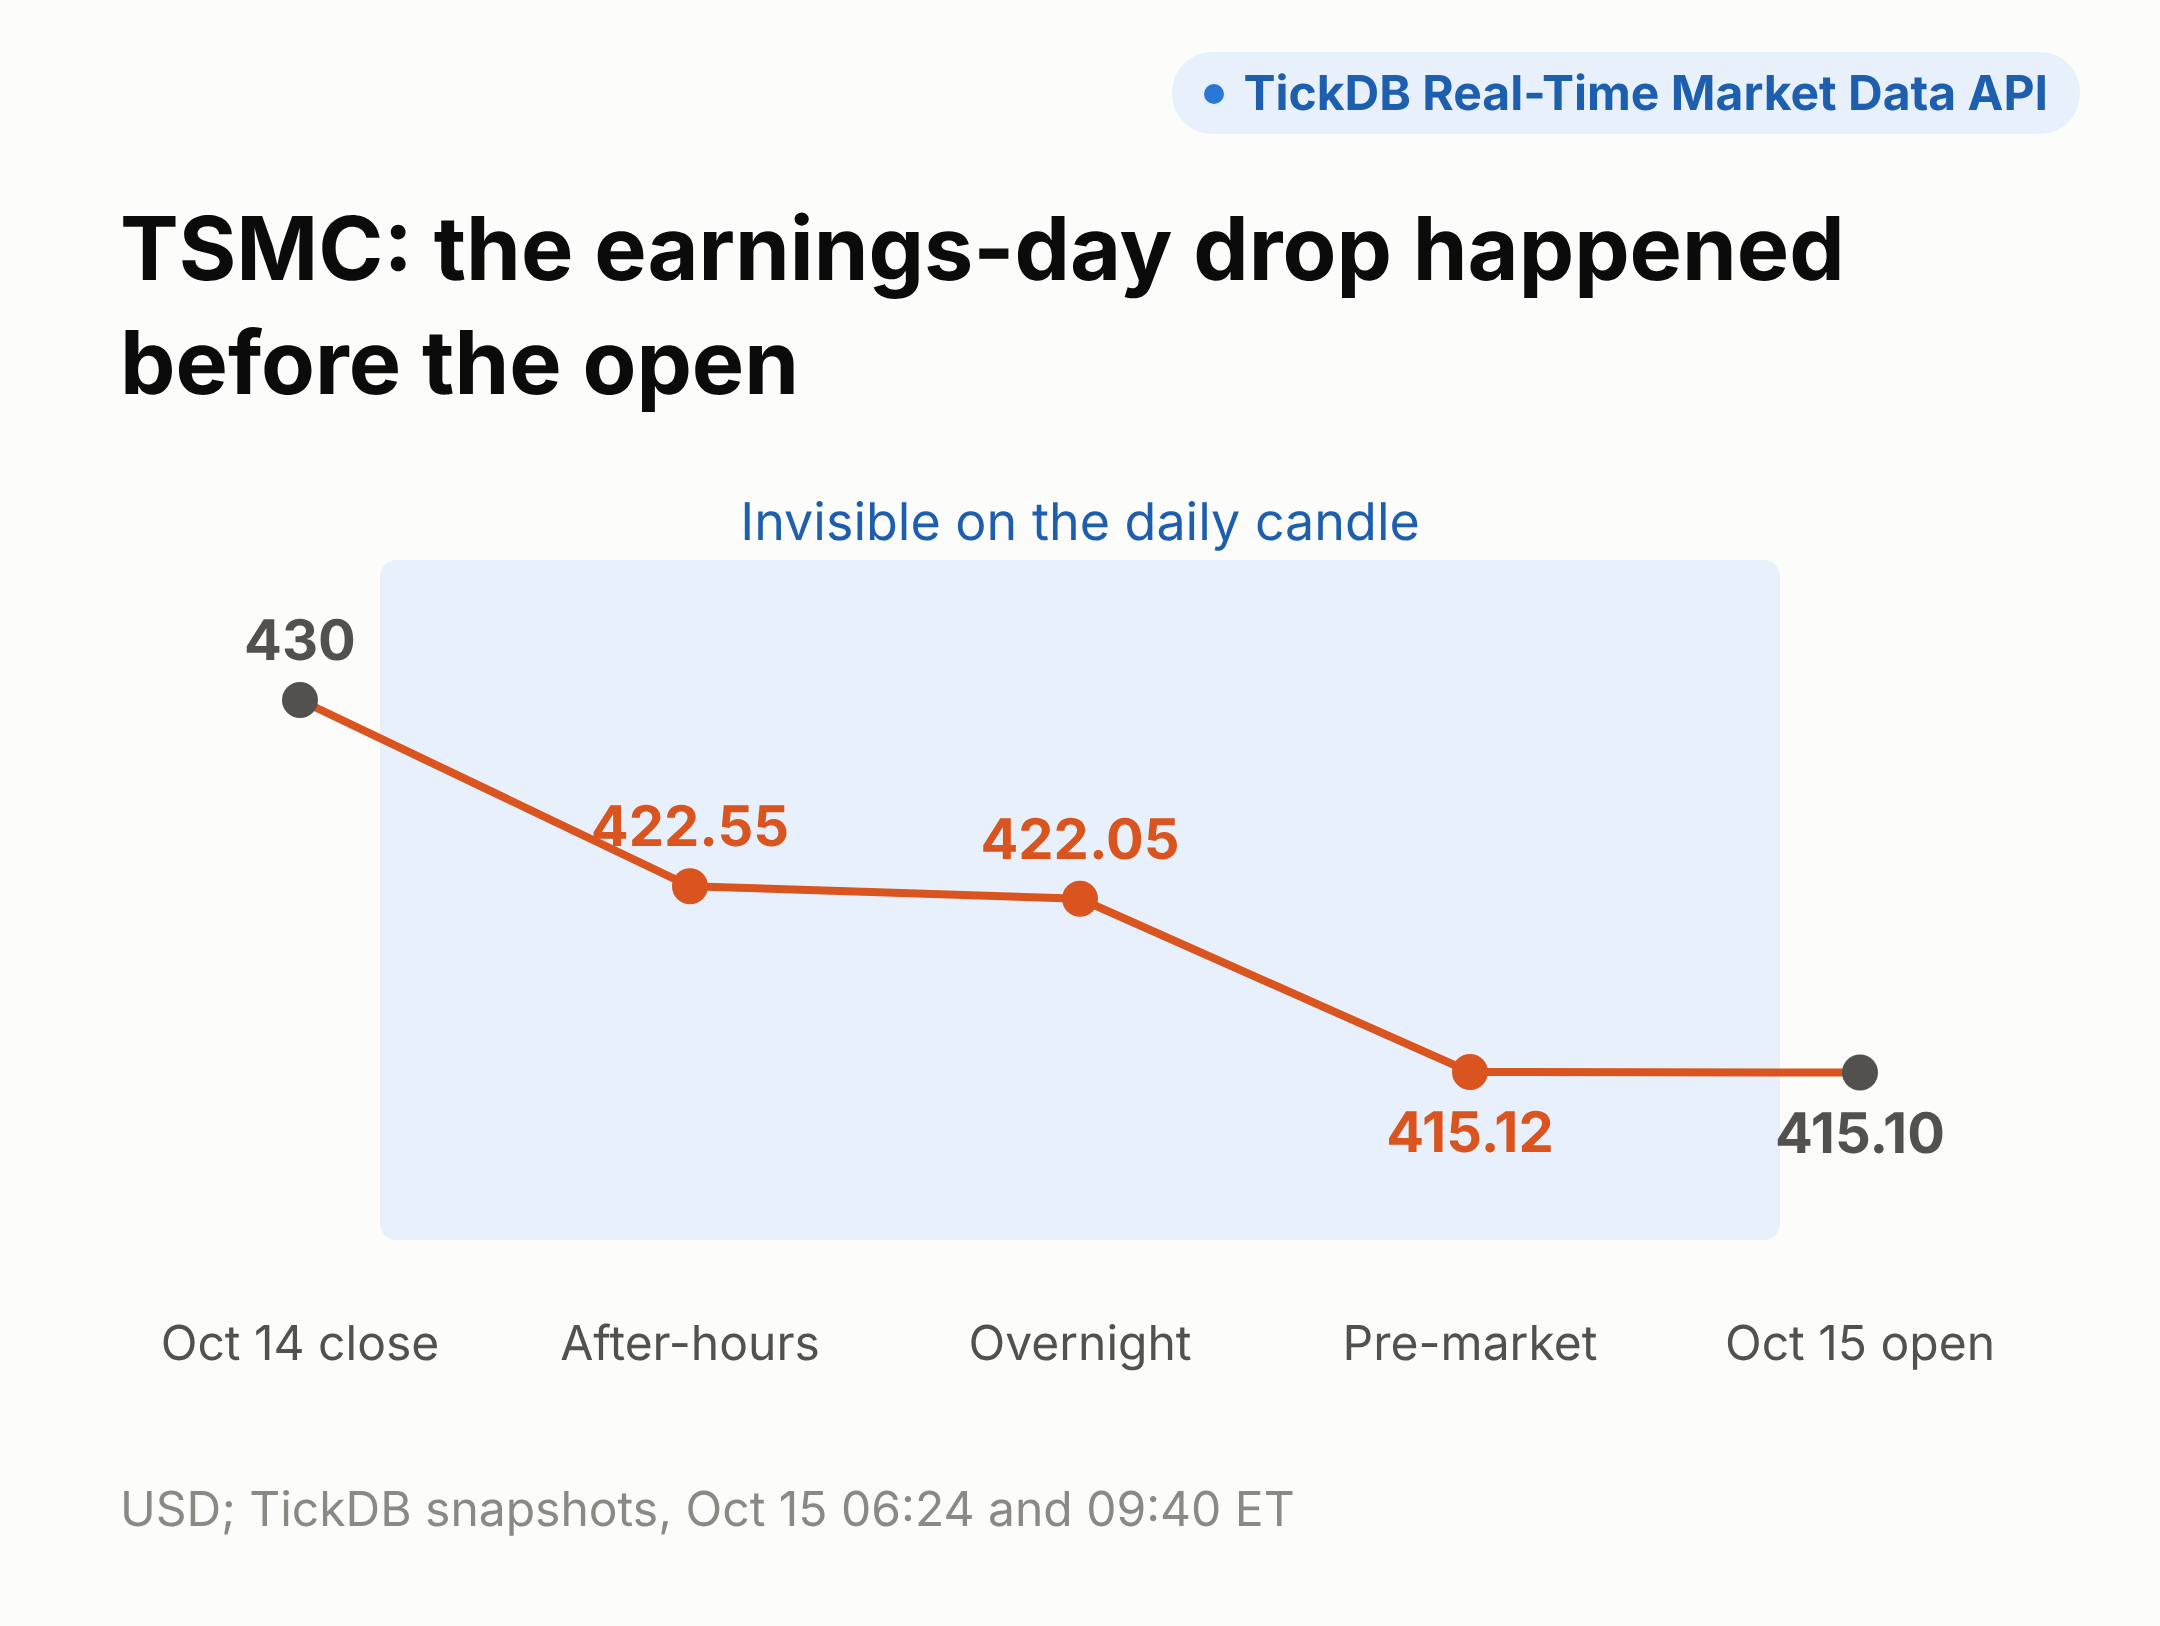
Candlestick charts only cover regular hours, though. I checked Apple at the same time: pre-market was trading, but the last 1-minute bar was still the previous day's 15:59. So the daily chart shows a gap, and the slide from after-hours into pre-market is nowhere on it. Users watch the price on the quote card move while the chart sits still, and assume the app has frozen.
Evidence 2: an off-hours "last price" can come from a handful of trades
Take Apple on October 14: 3.828 million shares traded after hours and 97,600 overnight, against 50.06 million in the regular session. After-hours and overnight together came to less than a tenth of regular volume. With that little volume, a few orders can move the price.
The SEC's investor bulletin on extended-hours trading lists exactly these risks: less trading interest, wider spreads, more volatility, and prices that "may not reflect the prices of those stocks during regular hours", including the next day's open.
Evidence 3: the opening direction doesn't always hold
JPMorgan reported before the open on October 13. It opened at 339.97, 1.7% above the previous close of 334.30, then closed at 331.43, down 0.86%.
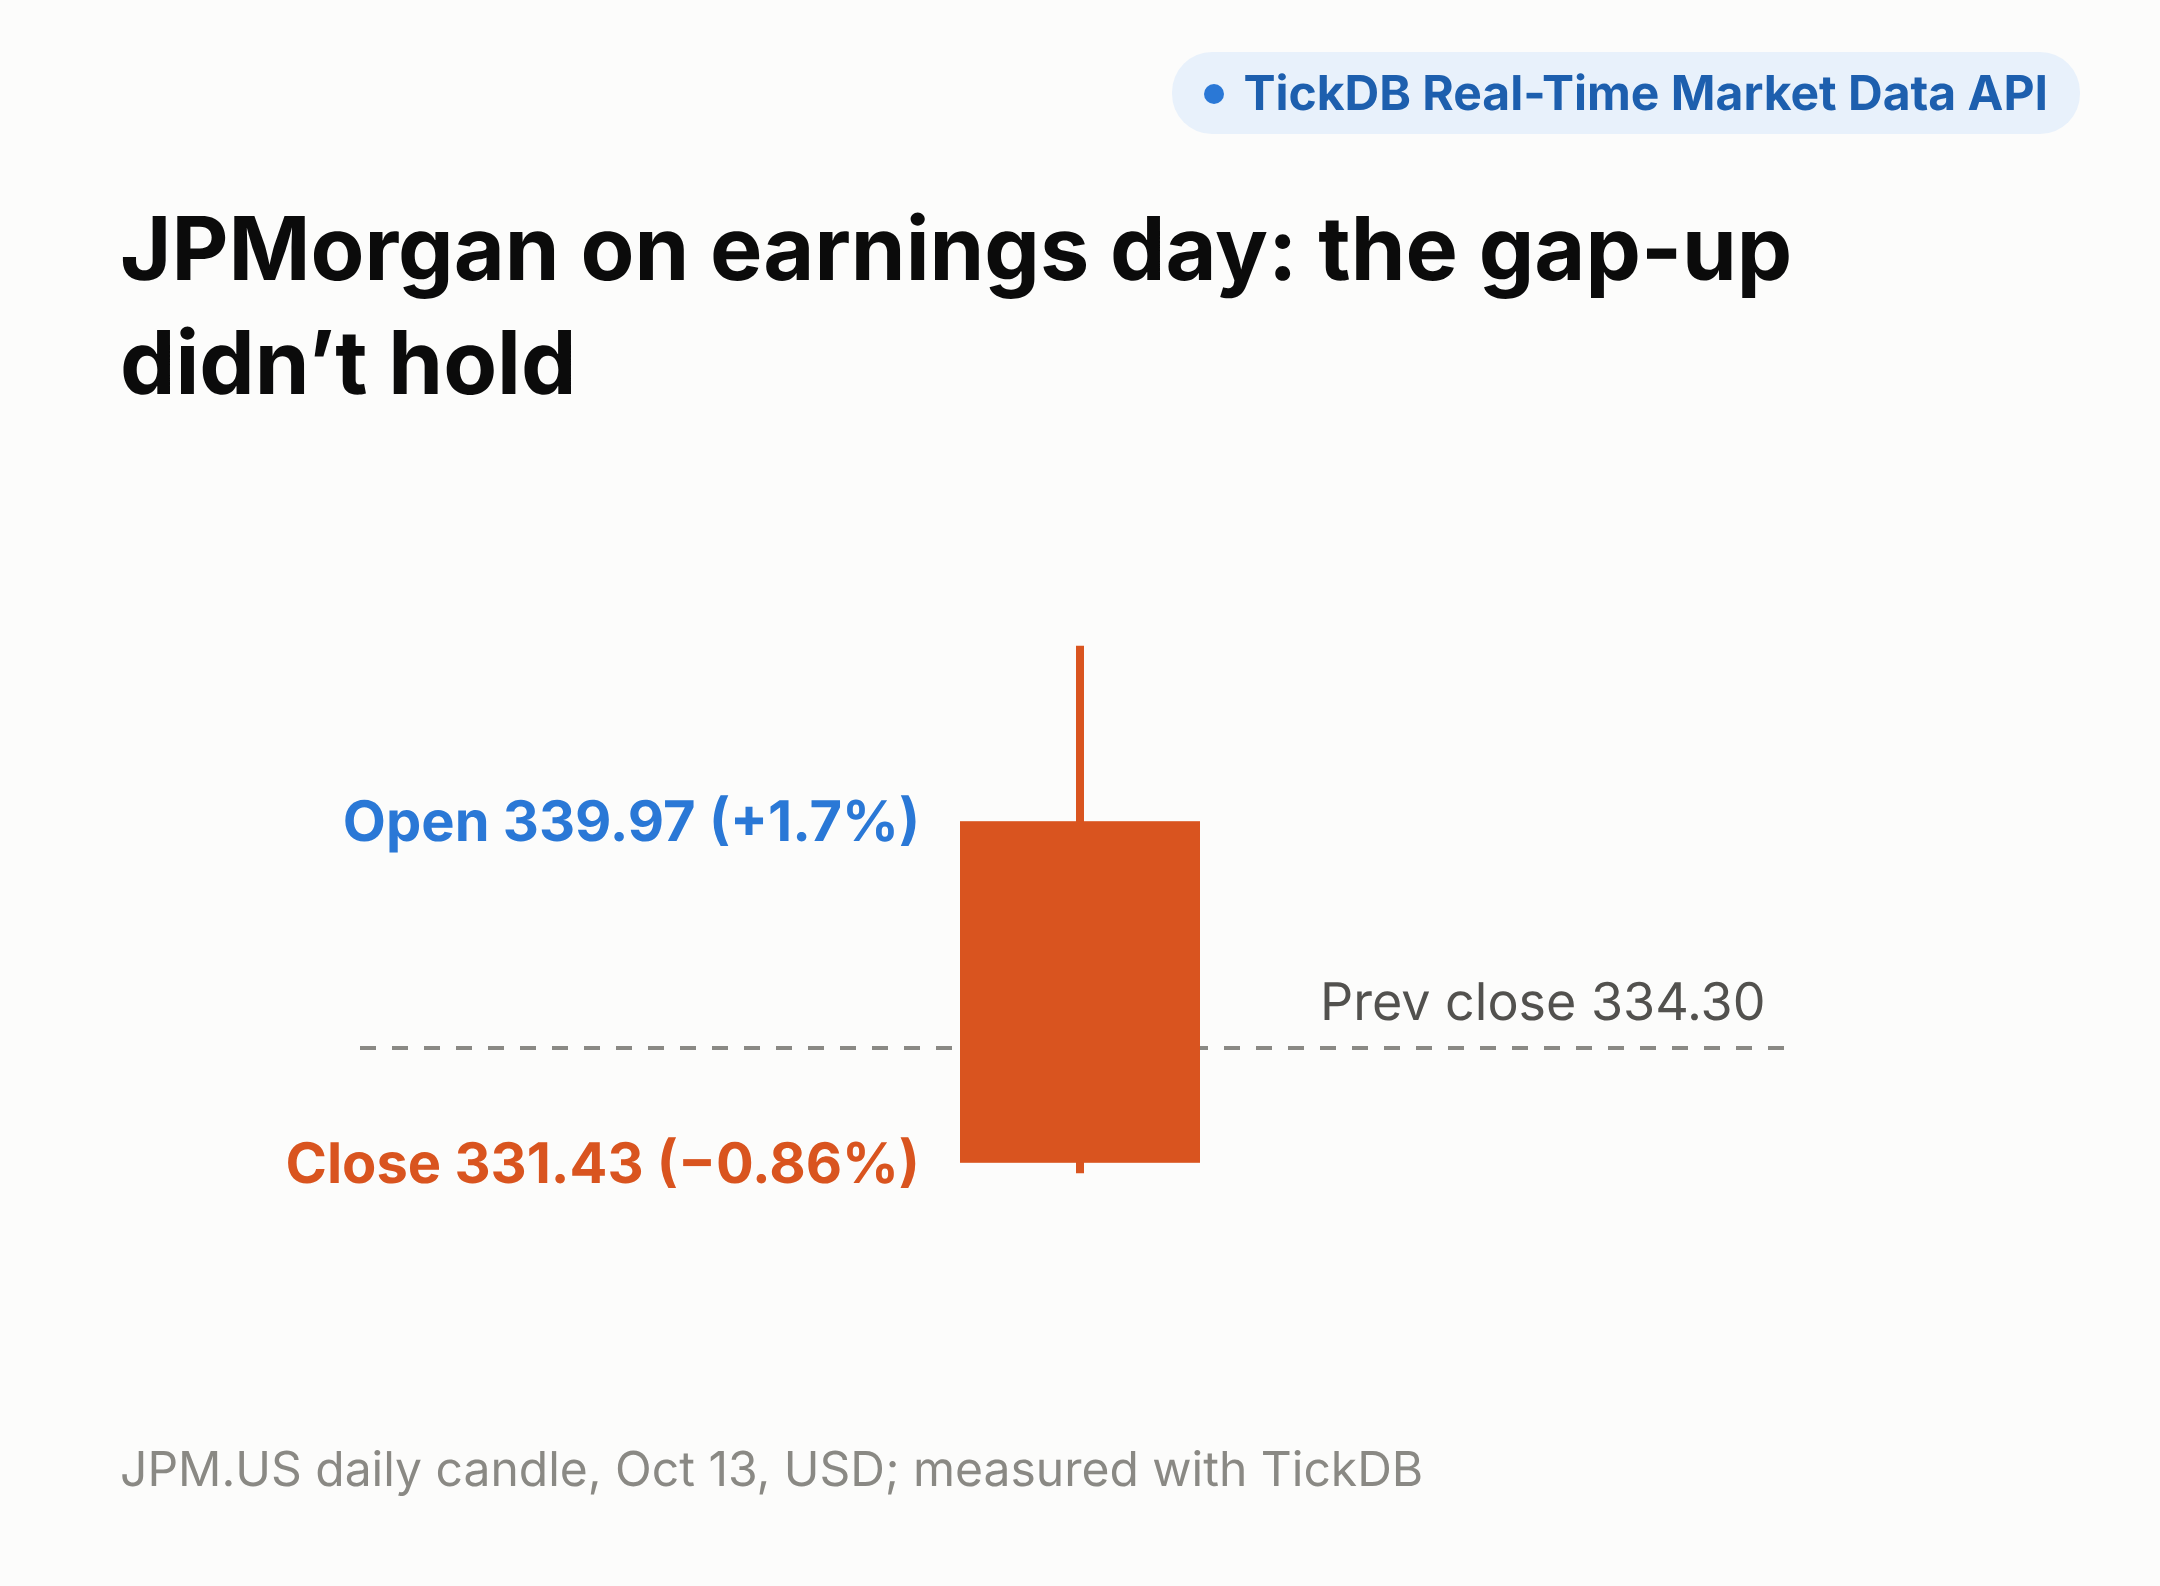
An app that pushed "JPMorgan opens up 1.7%" at the bell would have told a different story by the close. One broker's investor education page makes the same point: in pre-market and after-hours trading, prices can overreact to news and often reverse once regular trading opens.
Put the three together: during earnings season, an extended-hours percentage is a provisional answer, set by a small number of traders in thin volume. The interface should say which session it's from and how much traded, instead of showing a bare percentage.
For apps that serve users across markets, there's one more trap: "after hours" doesn't mean the same thing everywhere.
3. Why users from Asian markets misread US after-hours
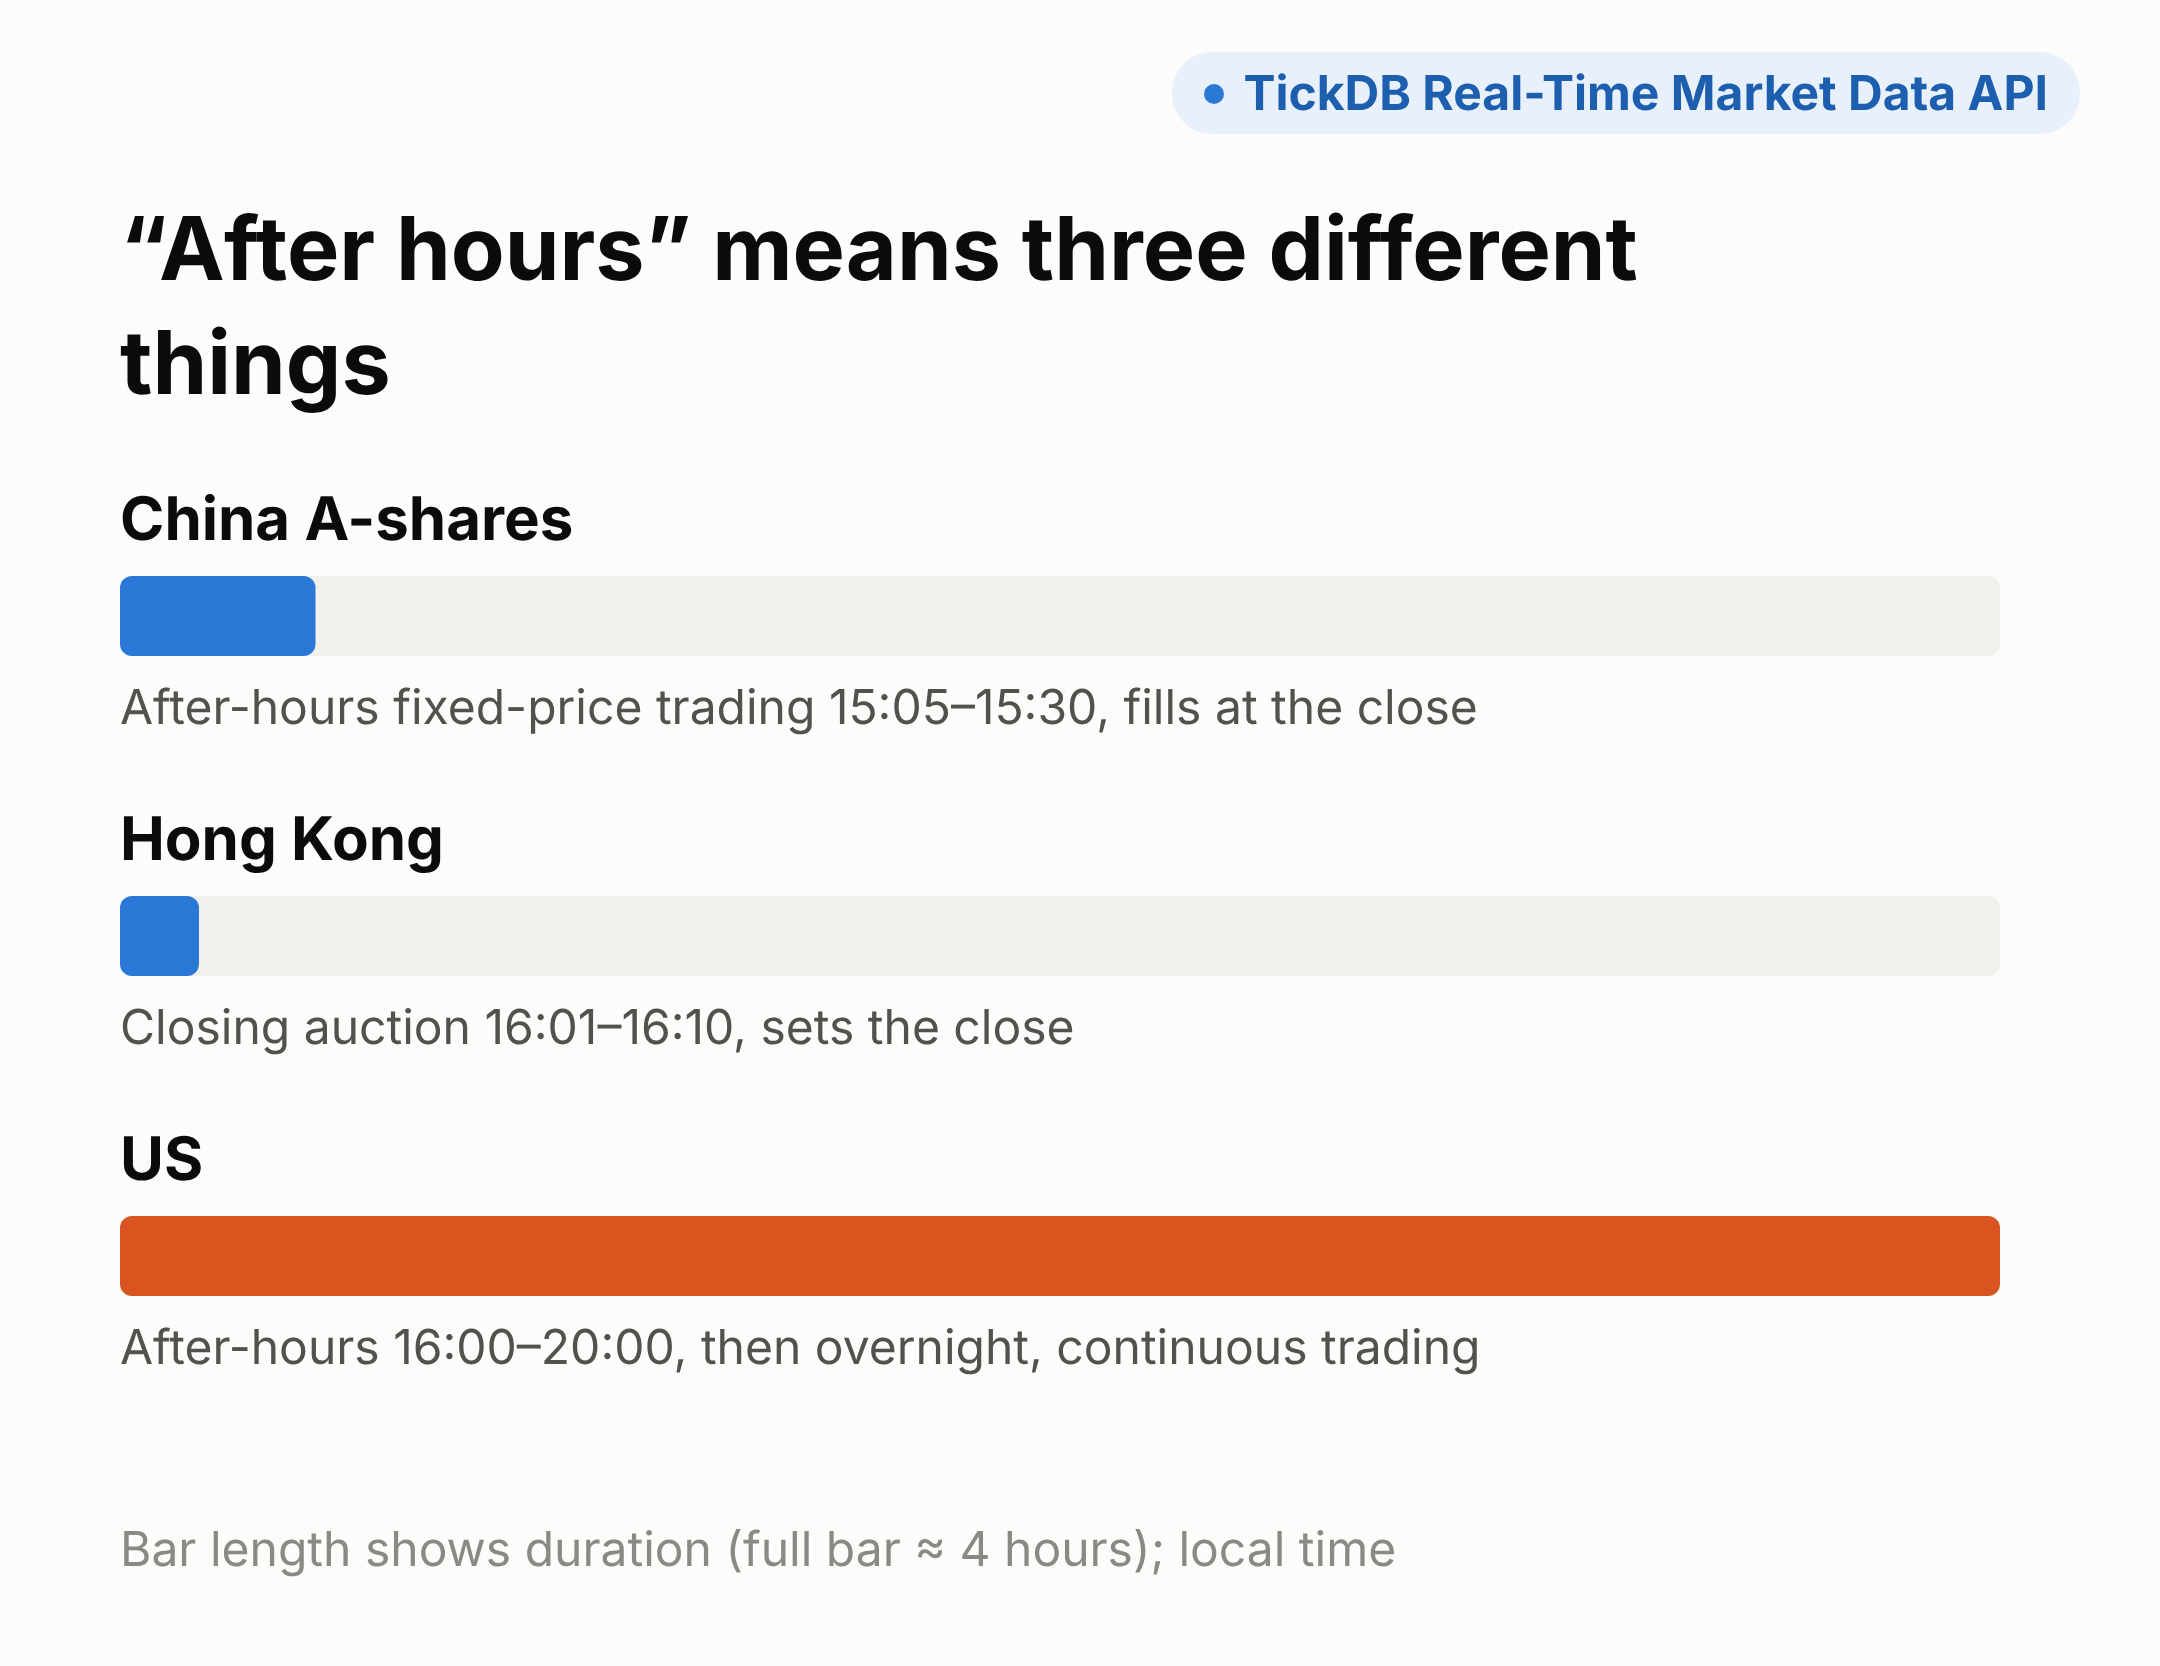
In China and Hong Kong, the after-hours price is fixed. In the US, it keeps moving.
China A-shares have after-hours fixed-price trading from 15:05 to 15:30, and every trade fills at that day's closing price. Since July 6, 2026, it covers all A-shares and exchange-listed ETFs, not just the STAR Market and ChiNext. Hong Kong runs a closing auction from 16:01 to 16:10, with a random close between 16:08 and 16:10 that sets the closing price. In both markets, "after the close" means trading at the close. The price doesn't move.
The US is different. After-hours trading runs continuously from 16:00 to 20:00 ET, followed by overnight trading from 20:00 to 04:00, and the price updates with every trade.
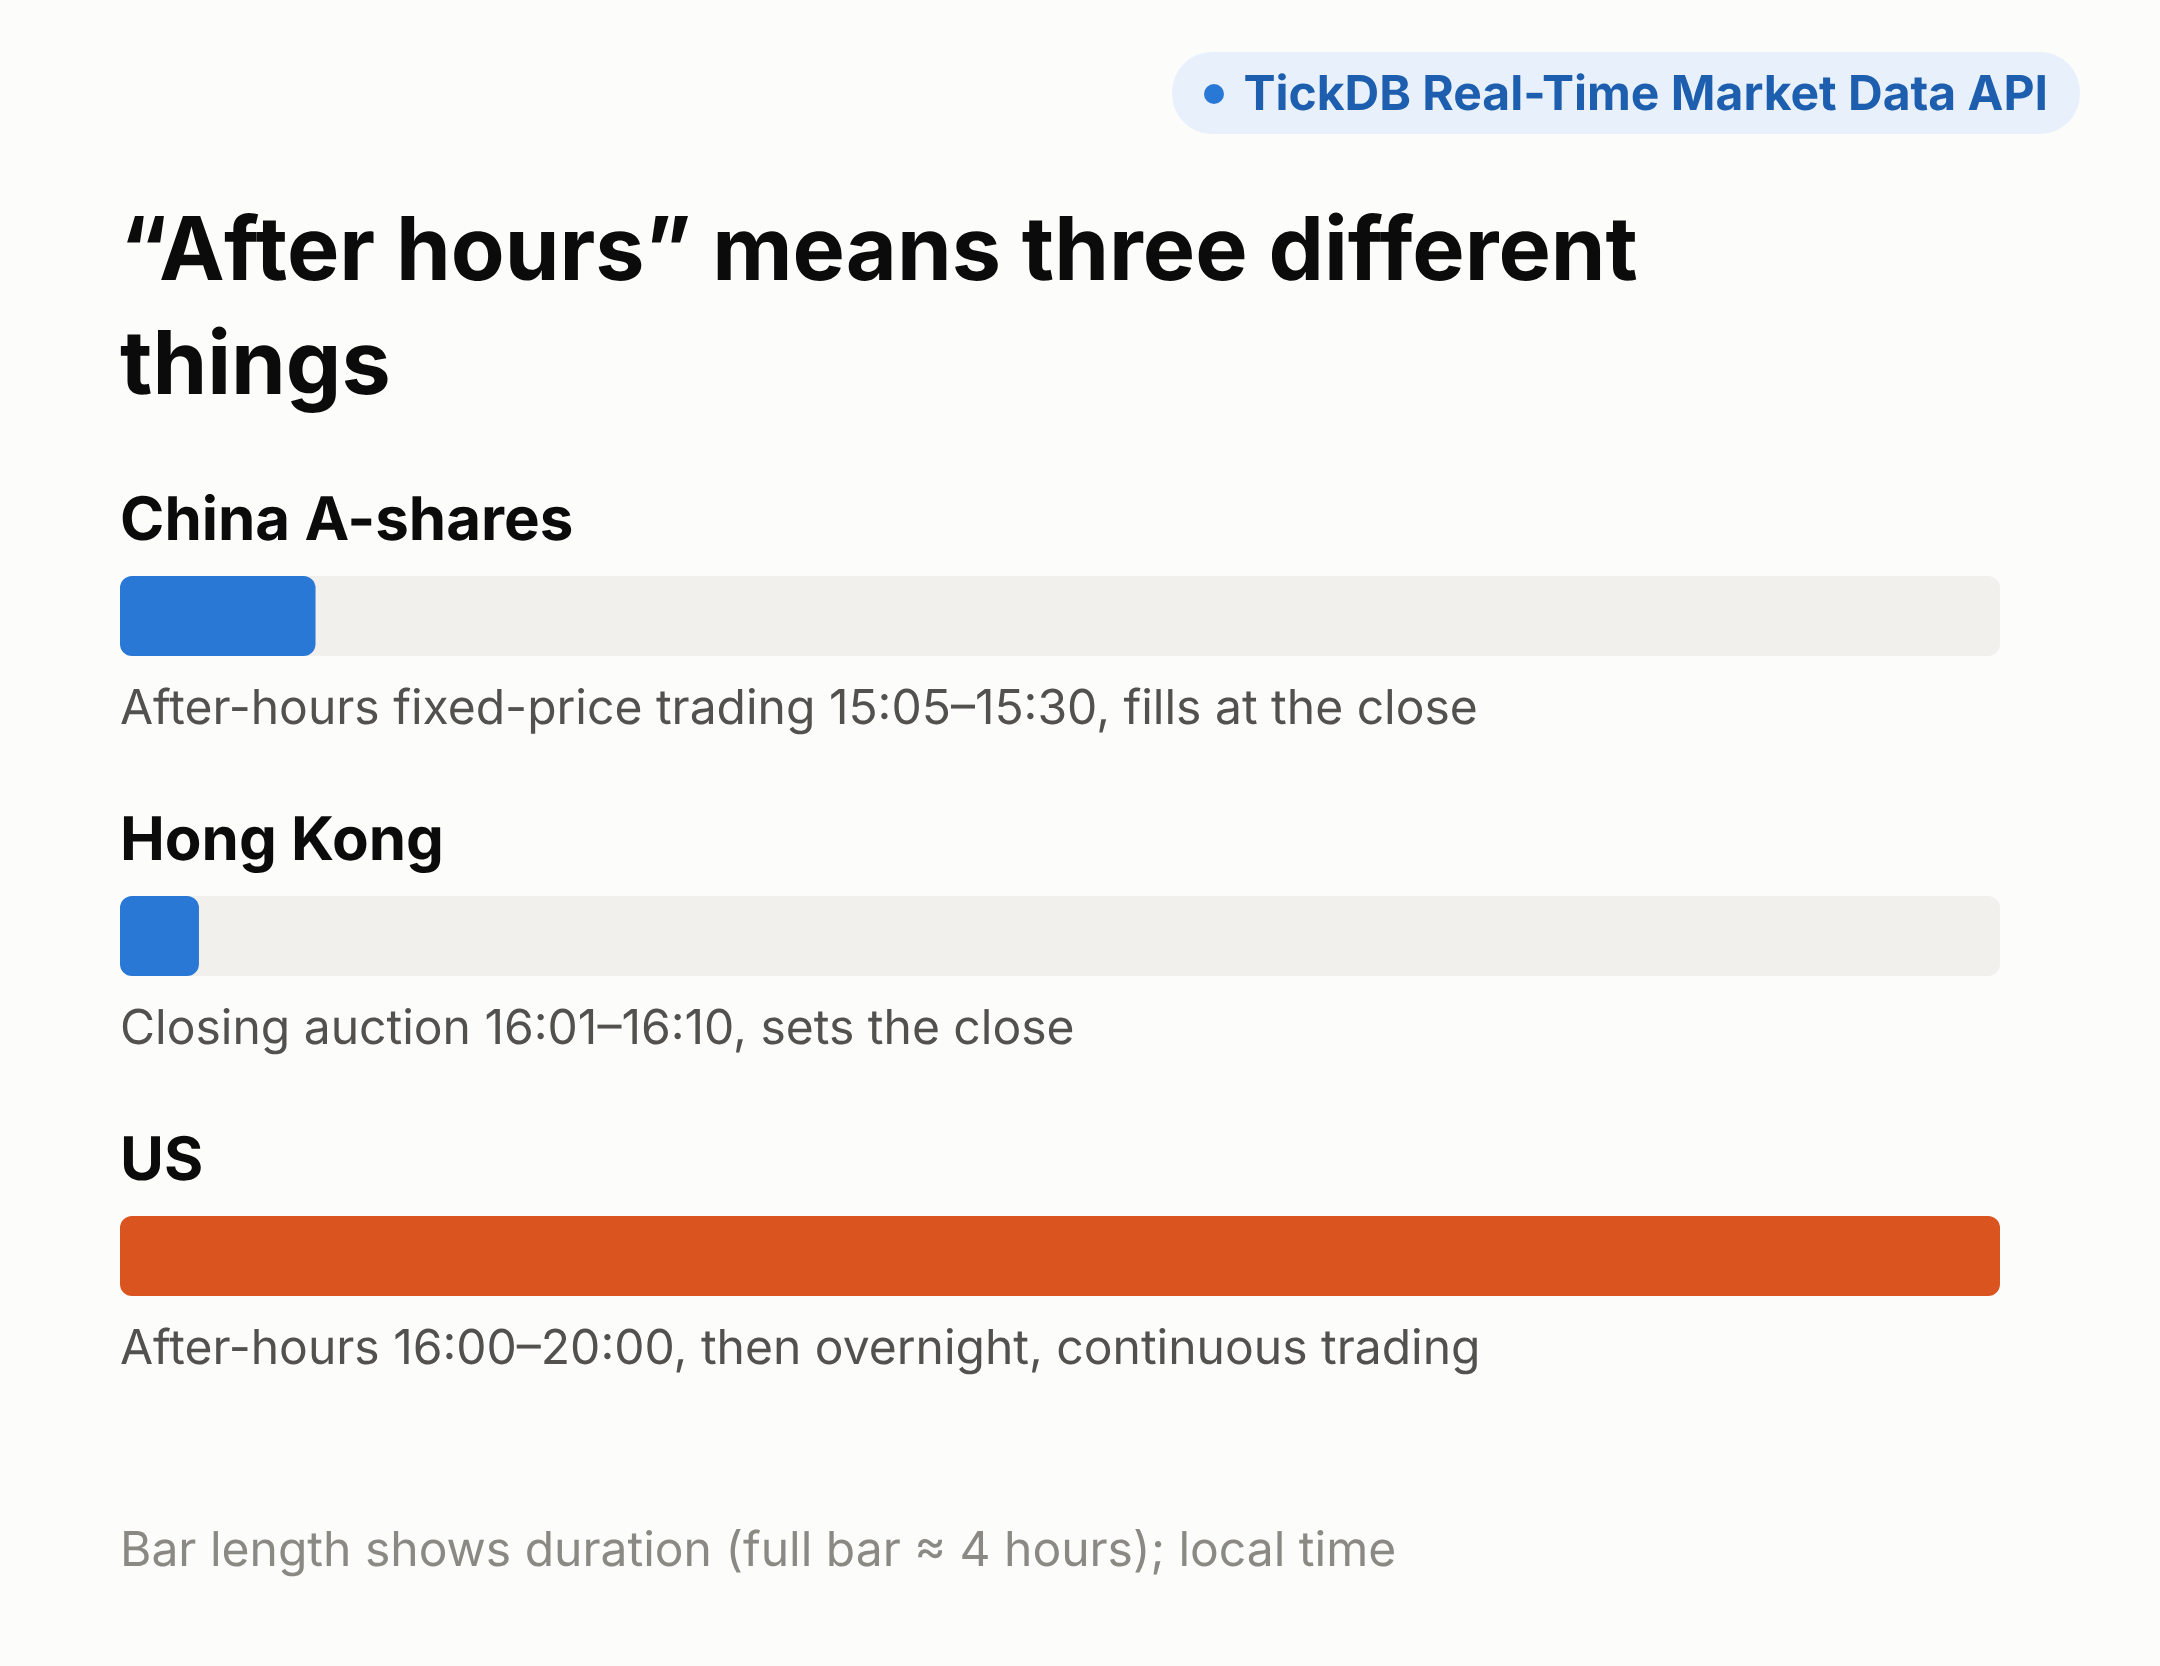
That leads to a common misreading. An investor used to A-shares sees a US stock "up 1% after hours" and reads it as settled: today's move is done, and tomorrow opens at this price. In fact that 1% is a provisional price from thin after-hours trading, and the next open can look very different, as JPMorgan showed.
How do US brokers handle it? Robinhood's help center explains that the after-hours change reflects the difference between the current price and the regular-market close. That's the +0.68% method from Section 1: name the session first, then say which close it's measured against.
So a cross-market app can't use one "after hours" label for all three markets. A-share fixed-price trading, Hong Kong's closing auction, and US after-hours and overnight sessions need separate labels. Otherwise users will make a "settled" judgment on a price that's still moving.
Turn the first three sections into interface decisions and you get three rules.
4. Three display rules for market data apps
Rule 1: Label the session
Pick the headline price from the current session and label it, for example "Pre-market 06:24 ET". Users should see at a glance which session the price comes from, not a generic "last price".
Rule 2: Label the baseline
Measure pre-market, after-hours and overnight changes against the latest regular close. Show the regular-session change on its own line, with its date. Don't compute a pre-market change from the main quote's previous close: that's exactly how +1.18% happens.
Rule 3: Treat off-hours volume and alerts separately
Show after-hours and overnight volume on their own, not folded into the day's total. Tag price alerts triggered outside regular hours with "after-hours, thin liquidity", or only send alerts during regular hours. Otherwise a user woken at 3 a.m. by "Apple up more than 1%" will treat it as a firm signal when it's a few trades.
One more fix while you're there: earnings times. Store them in Eastern time and convert by time zone name for display; never hard-code an offset. US daylight saving time ends on November 1, so 4:00 p.m. ET moves from 04:00 to 05:00 in Beijing. Apple's November 2 after-close report lands at 5 a.m. on November 3 for users in China.
Here's how the rules map to the parts of an app:
| Module | What users see today | What to change |
|---|---|---|
| Quote card | One "last price", session unknown | Pick by session; show session and ET time |
| % change, top movers | +1.18% pre-market, doesn't match other apps | Off-hours vs latest close; regular change on its own line |
| Chart | Price moves, chart doesn't | Add a "latest after-hours price" reference line |
| Volume | Off-hours volume mixed into the day | Show after-hours and overnight volume separately |
| Price alerts | False alarms overnight | Tag thin liquidity, or alert only in regular hours |
| Earnings calendar | Off by an hour after DST ends | Convert by time zone name; mark pre-market or after-close |
How to read it: the first two rows decide which number to show; the last four decide when and how to flag it. Data from tests on October 13–15, 2026.
How to build it
TickDB provides a unified global market data API for developers and AI applications, giving teams real-time and historical data across major markets — including US, Hong Kong and China A-shares — through a single integration, so they can ship market data, analytics and monitoring products faster.
The prices and timestamps in this post come from its US stock snapshot: one request returns the regular, pre-market, after-hours and overnight quotes together, each with its own price, timestamp, volume and previous close (pre_market_quote, post_market_quote, overnight_quote). Everything the three rules need is in that one response.
The code below picks the most recent session as the headline price, measures each session against its own previous close, and labels the time in ET:
# Tested: Python 3.11 / 2026-10-16 (checked against two real snapshots from Oct 15)
# Purpose: pick the headline price by current session and label session, time and baseline
import os
from datetime import datetime
from decimal import Decimal
from zoneinfo import ZoneInfo

import requests

ET = ZoneInfo("America/New_York")
EXTENDED = {"pre_market_quote": "Pre-market", "post_market_quote": "After-hours", "overnight_quote": "Overnight"}

def get_quote(symbol):
    r = requests.get("https://api.tickdb.ai/v1/market/ticker", params={"symbols": symbol},
                     headers={"X-API-Key": os.environ["TICKDB_API_KEY"]}, timeout=10)  # keep the key server-side
    body = r.json()
    if body.get("code") != 0:
        raise RuntimeError(body.get("message"))
    return body["data"][0]

def pct(last, base):
    return (Decimal(str(last)) - Decimal(str(base))) / Decimal(str(base)) * 100

def price_card(q):
    # Regular session: compare with the main quote's own prev_close (it only rolls at the open)
    rows = [("Regular", q["last_price"], int(q["timestamp"]), pct(q["last_price"], q["prev_close"]))]
    # Pre-market / after-hours / overnight: compare with the object's prev_close, i.e. the latest regular close
    for key, name in EXTENDED.items():
        s = q.get(key)
        if s:
            rows.append((name, s["last_done"], int(s["timestamp"]), pct(s["last_done"], s["prev_close"])))
    main = max(rows, key=lambda r: r[2])                      # the most recent session wins
    fmt = lambda r: f"{r[0]} {r[1]}  {r[3]:+.2f}%  {datetime.fromtimestamp(r[2] / 1000, ET):%m-%d %H:%M} ET"
    return {"main": fmt(main), "others": [fmt(r) for r in rows if r is not main]}

if __name__ == "__main__":
    print(price_card(get_quote("AAPL.US")))
Set the TICKDB_API_KEY environment variable and run it; keep the key on the server. Run against the October 15, 6:24 a.m. snapshot, the headline line reads "Pre-market 345.28 +0.68% 10-15 06:24 ET": the number that answers "how much has it moved in pre-market".
A percentage change is never wrong on its own. What's wrong is not telling users which question it answers. All three numbers can share a screen, as long as each one says which session the price is from and which day's close it's measured against.
Tonight, after the US close, open your own app's Apple page and check two things: does the price say which session it's from, and does the change say what it's compared with?
References
All accessed October 16, 2026.
- U.S. Securities and Exchange Commission, Office of Investor Education and Advocacy, "Extended-Hours Trading: Investor Bulletin", June 6, 2022. investor.gov
- Robinhood Help Center, "Robinhood 24 Hour Market" and "Extended-hours trading". robinhood.com
- moomoo Learn, "Premarket trading and after-hours trading". moomoo.com
- CCTV News via Yangtse Evening Post, "Three revisions to A-share trading rules take effect today", July 6, 2026.
- CITIC Securities (Hong Kong), "Closing Auction Session" service note. citics.com.hk
- Davis Polk, "Nasdaq and NYSE Reminders on Material News Announcements", November 3, 2015. davispolk.com
- TSMC Investor Relations, quarterly results schedule. investor.tsmc.com
- The Old Farmer's Almanac, "Daylight Saving Time Ends". almanac.com
- Apple, TSMC and JPMorgan prices, volume, candles and earnings calendar: measured with TickDB, October 13–15, 2026.