Stock API in Practice: Using MCP to Analyze Tech Stocks, Gold, and Forex
TickDB Research ·
Stock API in Practice: Using MCP to Analyze Tech Stocks, Gold, and Forex
Abstract: A stock API gives AI access to real-time U.S. stock market data and historical price bars. Combining those records with gold prices and forex quotes makes cross-market analysis possible. This walkthrough uses actual TickDB MCP requests to examine the October 22, 2026 technology stock selloff, calculate comparable returns, and separate price observations from explanations.
When technology stocks fall, do gold and the yen rise together? Answering that question requires data from several markets, a consistent observation window, and a clear definition of each return.
On October 21, 2026, Meta reported third-quarter results and narrowed its full-year capital expenditure guidance from $130–145 billion to $135–145 billion. It also disclosed a new arrangement involving Class C non-voting common stock. That disclosure should not be read as money already raised. Reuters’ market report the following day linked the technology selloff to concerns about AI spending and financing: Meta fell about 7%, while the Nasdaq Composite declined about 2.6%.
The yen strengthened against the dollar that day, but gold fell. The behavior of a single stock, or the assumption that rising risk lifts every perceived safe haven, cannot describe the whole session.
The following example turns that question into a series of inspectable requests and calculations.
Choose the instruments before drawing conclusions
A stock API returns structured records such as quotes and historical price bars. A cross-market comparison also needs instruments outside equities. This example uses:
- META.US: Meta shares, quoted in dollars per share, to observe the company reporting results.
- IXIC: the Nasdaq Composite, to compare the stock with a broader, technology-heavy equity index.
- XAUUSD: spot gold, quoted in dollars per ounce, to check whether gold moved differently from equities.
- USDJPY: dollars quoted in yen, to observe the yen’s movement against the dollar.
TickDB exposes these instruments through a common set of market data tools. The request and validation patterns can be reused across markets, while prices still need to be interpreted according to their instrument and quotation convention.
MCP makes those tools available to an AI client. The workflow is straightforward:
Define the question → Select instruments and parameters
→ Call the market data API through MCP → Validate the response
→ Calculate relative changes → Produce a chart and explanation
TickDB supplies market data; the AI client coordinates requests, calculations, and presentation.
Inspect an actual historical data request
TickDB MCP’s get_kline retrieves historical price bars. The following is the actual Meta request used for this example, shown as a tool name and arguments rather than the complete MCP protocol envelope:
{
  "tool": "get_kline",
  "arguments": {
    "symbol": "META.US",
    "type": "stock",
    "interval": "5m",
    "adjust": "none",
    "start_time": 1792675800000,
    "end_time": 1792698900000,
    "limit": 1000
  }
}
interval selects five-minute bars, and adjust: none requests unadjusted stock prices. The millisecond timestamps specify bar start times from October 22 at 13:30 UTC through 19:55 UTC. The last bar ends at 20:00 UTC, or 4:00 p.m. U.S. Eastern time.
The successful response has business code 0, with records under data.klines. This excerpt shows the first bar’s price fields:
{
  "code": 0,
  "data": {
    "symbol": "META.US",
    "interval": "5m",
    "klines": [
      {
        "time": 1792675800000,
        "open": "676.35000000",
        "high": "681.07000000",
        "low": "657.40000000",
        "close": "657.41000000"
      }
    ]
  }
}
Prices arrive as strings and must be converted explicitly for calculation. Check the business code, required fields, and nonempty series first. An error or missing record is not a zero price.
The other three instruments were queried for the same interval and range. IXIC uses type: indices; XAUUSD and USDJPY use type: forex. In this example, adjust applies only to the stock request.
Compare returns rather than price levels
A share price, an index level, and an exchange rate have different units. Their raw levels do not make a meaningful comparison. Instead, calculate each instrument’s percentage change from the start of the selected window:
Change (%) = (current price / starting price − 1) × 100
The window covers the October 22 U.S. regular trading session, 13:30–20:00 UTC. Each response contains 78 five-minute bars. Using the first bar’s opening price and the last bar’s closing price gives:
- META.US: 676.35 → 648.87, a 4.06% decline.
- IXIC: 26,308.407 → 26,008.859, a 1.14% decline.
- XAUUSD: 4,076.61 → 4,027.93, a 1.19% decline.
- USDJPY: 157.234 → 156.862, a 0.24% decline in the currency pair.
These are returns within the chosen session window. Meta’s approximately 7% drop and the Nasdaq’s approximately 2.6% drop in the news report are previous-close-to-close returns. They also include the price adjustment that had already occurred before the regular session opened.
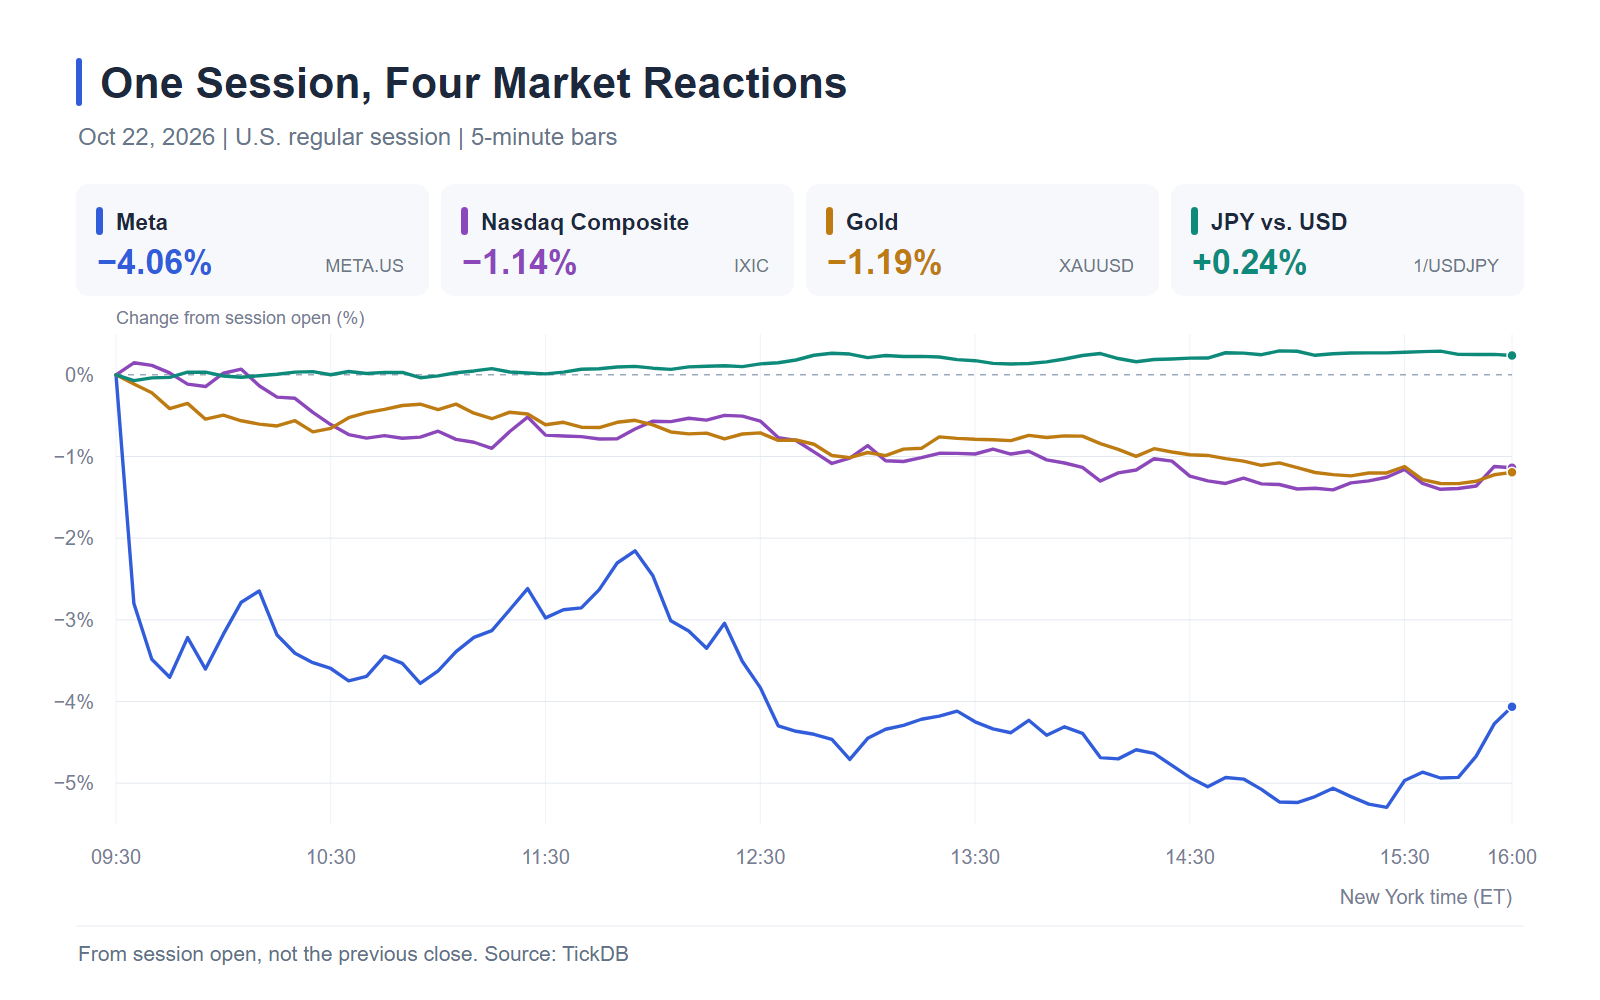
Chart: Actual five-minute data, with each series measured from its first opening price to subsequent completed bars’ closing prices. No interpolation is used. The yen series is calculated from 1/USDJPY to show the yen’s direction against the dollar directly.
The following Python reproduces the endpoint returns using only the standard library:
from decimal import Decimal

def change_pct(first, last, inverse=False):
    first, last = Decimal(first), Decimal(last)
    if not (first.is_finite() and last.is_finite()):
        raise ValueError("Prices must be finite numbers")
    if first <= 0 or last <= 0:
        raise ValueError("Prices must be positive")
    ratio = first / last if inverse else last / first
    return (ratio - 1) * 100

prices = {
    "META.US": ("676.35", "648.87"),
    "IXIC": ("26308.407", "26008.859"),
    "XAUUSD": ("4076.61", "4027.93"),
    "USDJPY": ("157.234", "156.862"),
}

for symbol, pair in prices.items():
    print(f"{symbol}: {change_pct(*pair):+.2f}%")

print(f"JPY vs. USD: {change_pct(*prices['USDJPY'], inverse=True):+.2f}%")
Output:
META.US: -4.06%
IXIC: -1.14%
XAUUSD: -1.19%
USDJPY: -0.24%
JPY vs. USD: +0.24%
What the comparison establishes
Three observations follow from these records.
Meta fell more than the Nasdaq during the selected session. Querying both the stock and the index shows whether their directions match and how their magnitudes differ. It does not isolate how much of the decline came from company news, sector conditions, or other factors.
Gold and the yen diverged. Gold fell approximately 1.19%, while the yen gained approximately 0.24% against the dollar. A falling USDJPY means fewer yen are required to buy one dollar. The inverse calculation makes that direction explicit; other currency pairs require the same attention to quotation order.
Intraday losses and daily losses answer different questions. One describes the move after the opening price; the other measures the move from the previous close. Preserving the prices and baseline keeps the AI’s explanation tied to a reproducible calculation.
Reuters also reported a move into U.S. Treasuries and a substantial decline in the 10-year yield. Oil faced a separate event involving Middle East supply risks. These observations provide context, but the four price series alone cannot establish why every asset moved or prove a single causal chain.
Continue from historical bars to a quote update
Historical bars describe a selected period. TickDB MCP’s get_ticker can retrieve a subsequent quote snapshot. The following multi-instrument request was also executed:
{
  "tool": "get_ticker",
  "arguments": {
    "symbols": "META.US,IXIC,XAUUSD,USDJPY"
  }
}
The response includes these regular-session fields for Meta:
{
  "symbol": "META.US",
  "last_price": "648.85",
  "prev_close": "697.52",
  "price_change_percent_24h": "-6.98",
  "timestamp": 1792699200000
}
The reported −6.98% corresponds to the approximately 7% daily decline. Its timestamp is October 22 at 20:00 UTC. When queried on October 23, the next U.S. regular session had not started, so these fields still described the previous session. The response separately included overnight quotes, which need to be read with their corresponding fields and timestamps.
The ticker’s 648.85 also differs slightly from the final five-minute bar’s 648.87; all session returns above consistently use the historical bars.
An AI client connected through MCP can continue with a follow-up such as:
Check the latest quotes for those instruments. How have they changed since the end of that window?
This is a suggested follow-up, rather than a transcript of an additional executed conversation. The client can reuse the instrument list, retrieve fresh records, and compare them with the stored endpoints while checking when each quote was recorded.
The TickDB MCP server is open source. Its repository contains tool definitions, connection instructions, and deployment files, allowing developers to inspect how queries map to the market data API or deploy the server themselves. Access to market data remains subject to the permissions of the API key in use.
Market data provided by TickDB.ai. Source code and setup instructions: TickDB MCP on GitHub.