Why Your TradingView Chart Shows the Wrong Day: 10 Pitfalls in Cross-Market Data Apps
TickDB Research ·
We drew Tencent's October 14 daily candle with TradingView's open-source Lightweight Charts, and the chart labeled it October 13. The library wasn't wrong and the data wasn't wrong. The bug sat in the step that feeds data into the chart. We fed the same real market data twice, once as-is and once through a small normalization layer, and found the 10 places where cross-market charts break most often. A copy-paste data feed layer is at the end.
On November 1, the US leaves daylight saving time. The NYSE still opens at 09:30 New York time, but every server that converts session times with a fixed offset will be an hour off the next morning.
Hong Kong may change its clock too. In late September, Bloomberg reported that HKEX was weighing an earlier 09:00 open and dropping the lunch break, and on October 9 the Securities and Futures Commission said HKEX would publish a discussion paper on longer trading hours this quarter.
Trading hours are moving. If you build market data apps, it's worth asking: is your chart's time axis hardcoded or computed?
We started with Tencent (700.HK). We drew daily candles with Lightweight Charts and fed in the API response as-is:
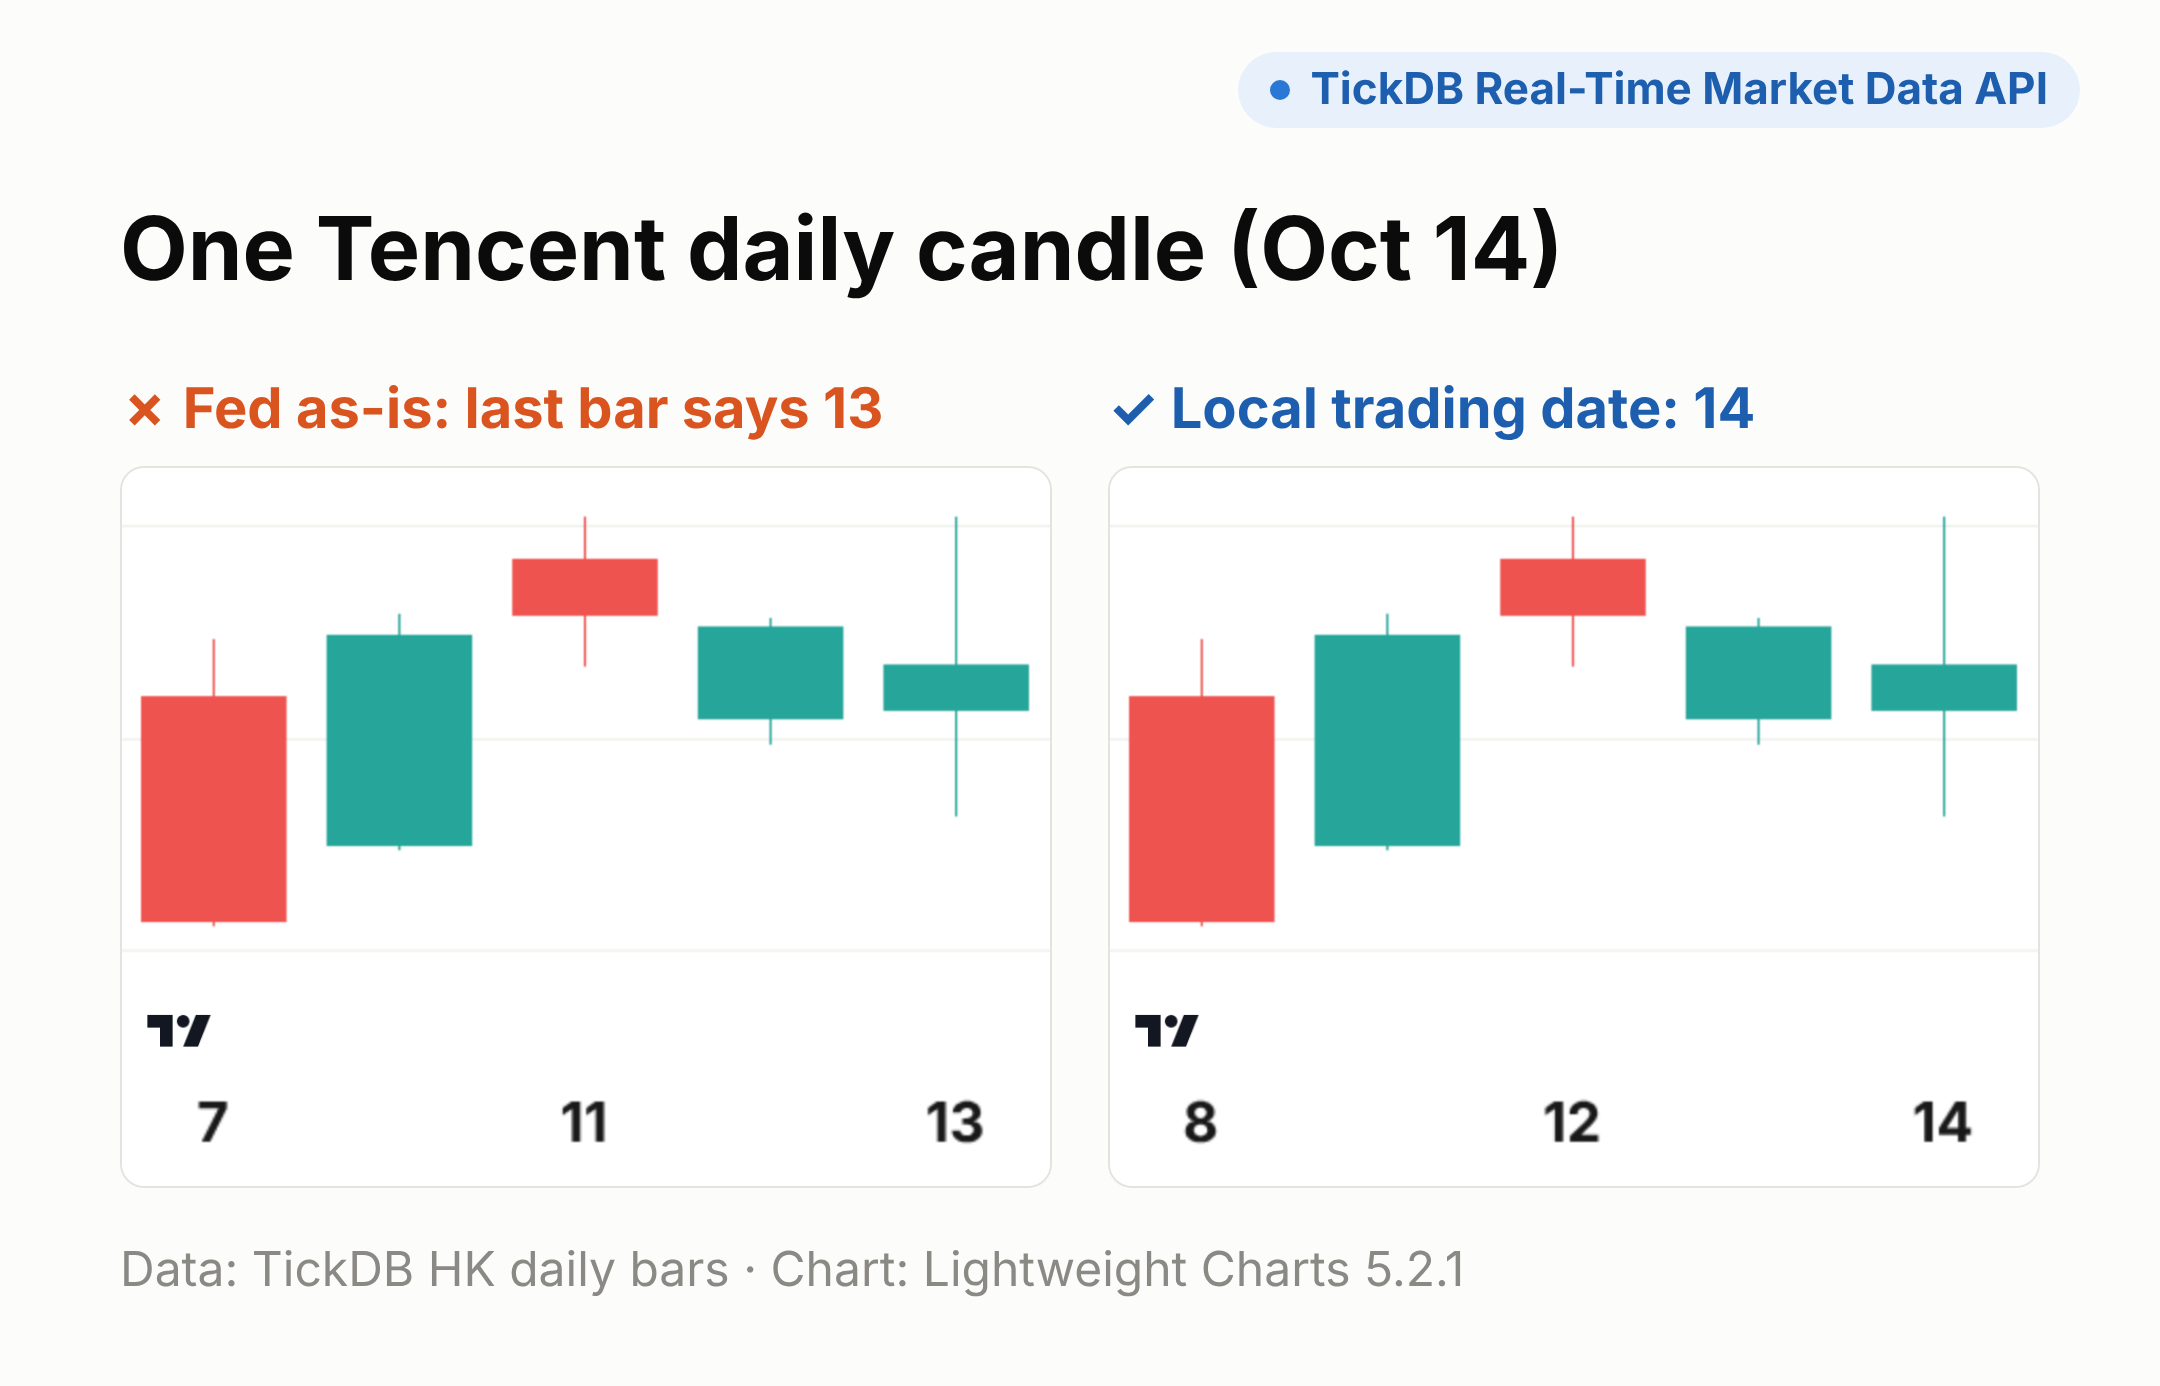
The October 14 candle says 13. The whole time axis is a day early.
In a single-market app, you might hit one or two of these. In an app that shows US stocks, Hong Kong stocks and China A-shares together, they show up all at once.
A charting library only draws. Whether it draws the right thing depends on how you feed it.
What you get: the 10 most common charting mistakes with fixes, a roughly 50-line data feed layer, and a pre-launch checklist.
1. The library draws. It doesn't know markets.
Lightweight Charts is free, small, and turns a few dozen lines of code into professional-looking candles. Plenty of trading tools and market data apps use it.
But it doesn't know which market a timestamp belongs to. It doesn't know that China and much of East Asia use red for up and green for down. It doesn't know the stock had a corporate action last month, or that a "1" in A-share volume means one lot of 100 shares. All of that has to be handled before the data reaches the chart. We call that step the data feed layer.
Every item below compares the same real data fed twice: once as-is, once through the feed layer. Instruments: Cambricon (688256.SH) for A-shares, Tencent (700.HK) for Hong Kong, Apple (AAPL.US) for the US, plus Bitcoin and USD/CNH.
2. The home-screen comparison chart
① Tencent's October 14 candle is labeled the 13th
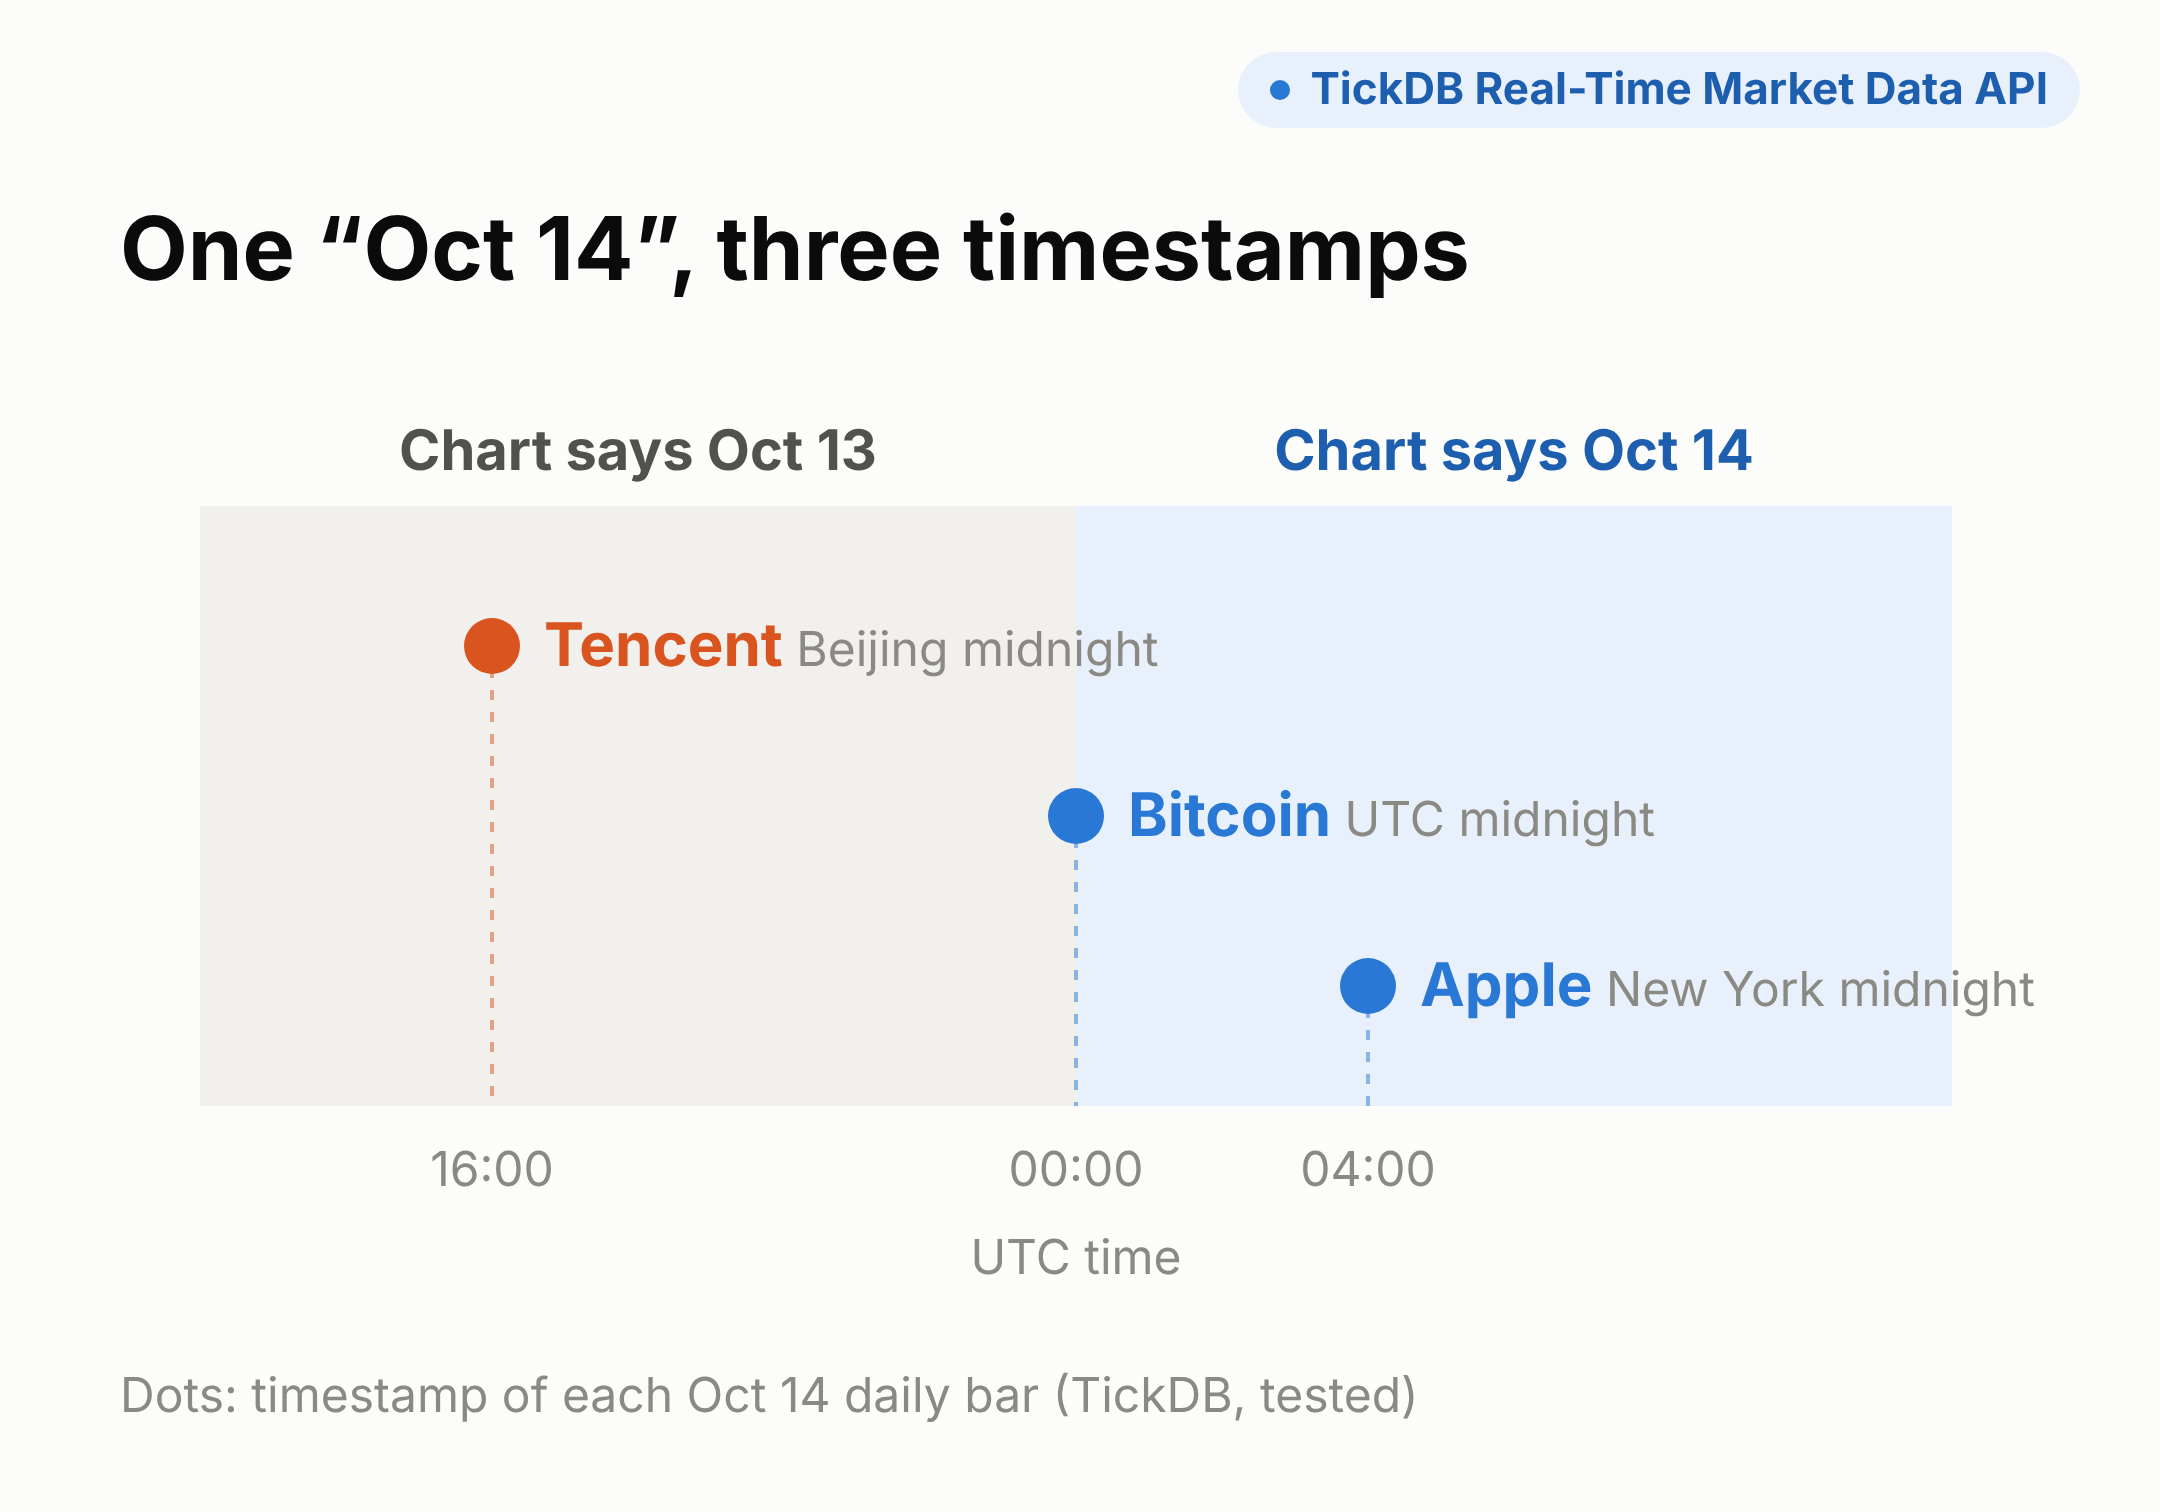
Market data APIs commonly stamp daily bars at local midnight on the exchange. Tencent's October 14 bar is stamped 00:00 Beijing time, which is 16:00 UTC on the 13th. Lightweight Charts formats time in UTC only, so it shows the 13th. Setting the user's computer to Beijing time doesn't help.
A user posting a screenshot that says "your dates are all wrong" does more damage than any bug report.
Fix: don't feed daily bars as timestamps. Convert them to the exchange's local date string, '2026-10-14', and feed that.
② Three markets on one chart, and the same day won't line up
Tencent is stamped at Beijing midnight, Apple at New York midnight, Bitcoin at UTC midnight. On a single time axis, "October 14" becomes three points, and Tencent's lands on the 13th.
Intraday bars have the same problem. In our 15-minute data, Cambricon's first bar is labeled 09:45 and Tencent's first bar 09:30: the A-share bars are stamped at the end of each period, the Hong Kong bars at the start. Each market has a bar labeled "09:45", and they cover adjacent 15-minute windows.
Cross-market correlation, pairs trading and "what did the US do after Hong Kong fell" views all depend on this alignment.
Fix: convert each market to its own local trading date first, then align. Someone also has to decide a product question: Apple's October 14 session runs from the evening of the 14th to the early morning of the 15th in Beijing. Which day does your home screen call it?
3. Single-stock charts
③ Up is green, down is red, and half your users read it backwards
Lightweight Charts defaults to green for up and red for down, the US and European convention. Users in mainland China, Taiwan and South Korea expect the opposite.
Fix: set up and down colors by user region, for candles and volume bars together.
④ Cambricon's ex-date looks like a 36.7% crash
May 8 was Cambricon's ex-date. The prior close was ¥1,868 and that day's close ¥1,182.53, so the unadjusted chart shows a huge gap.
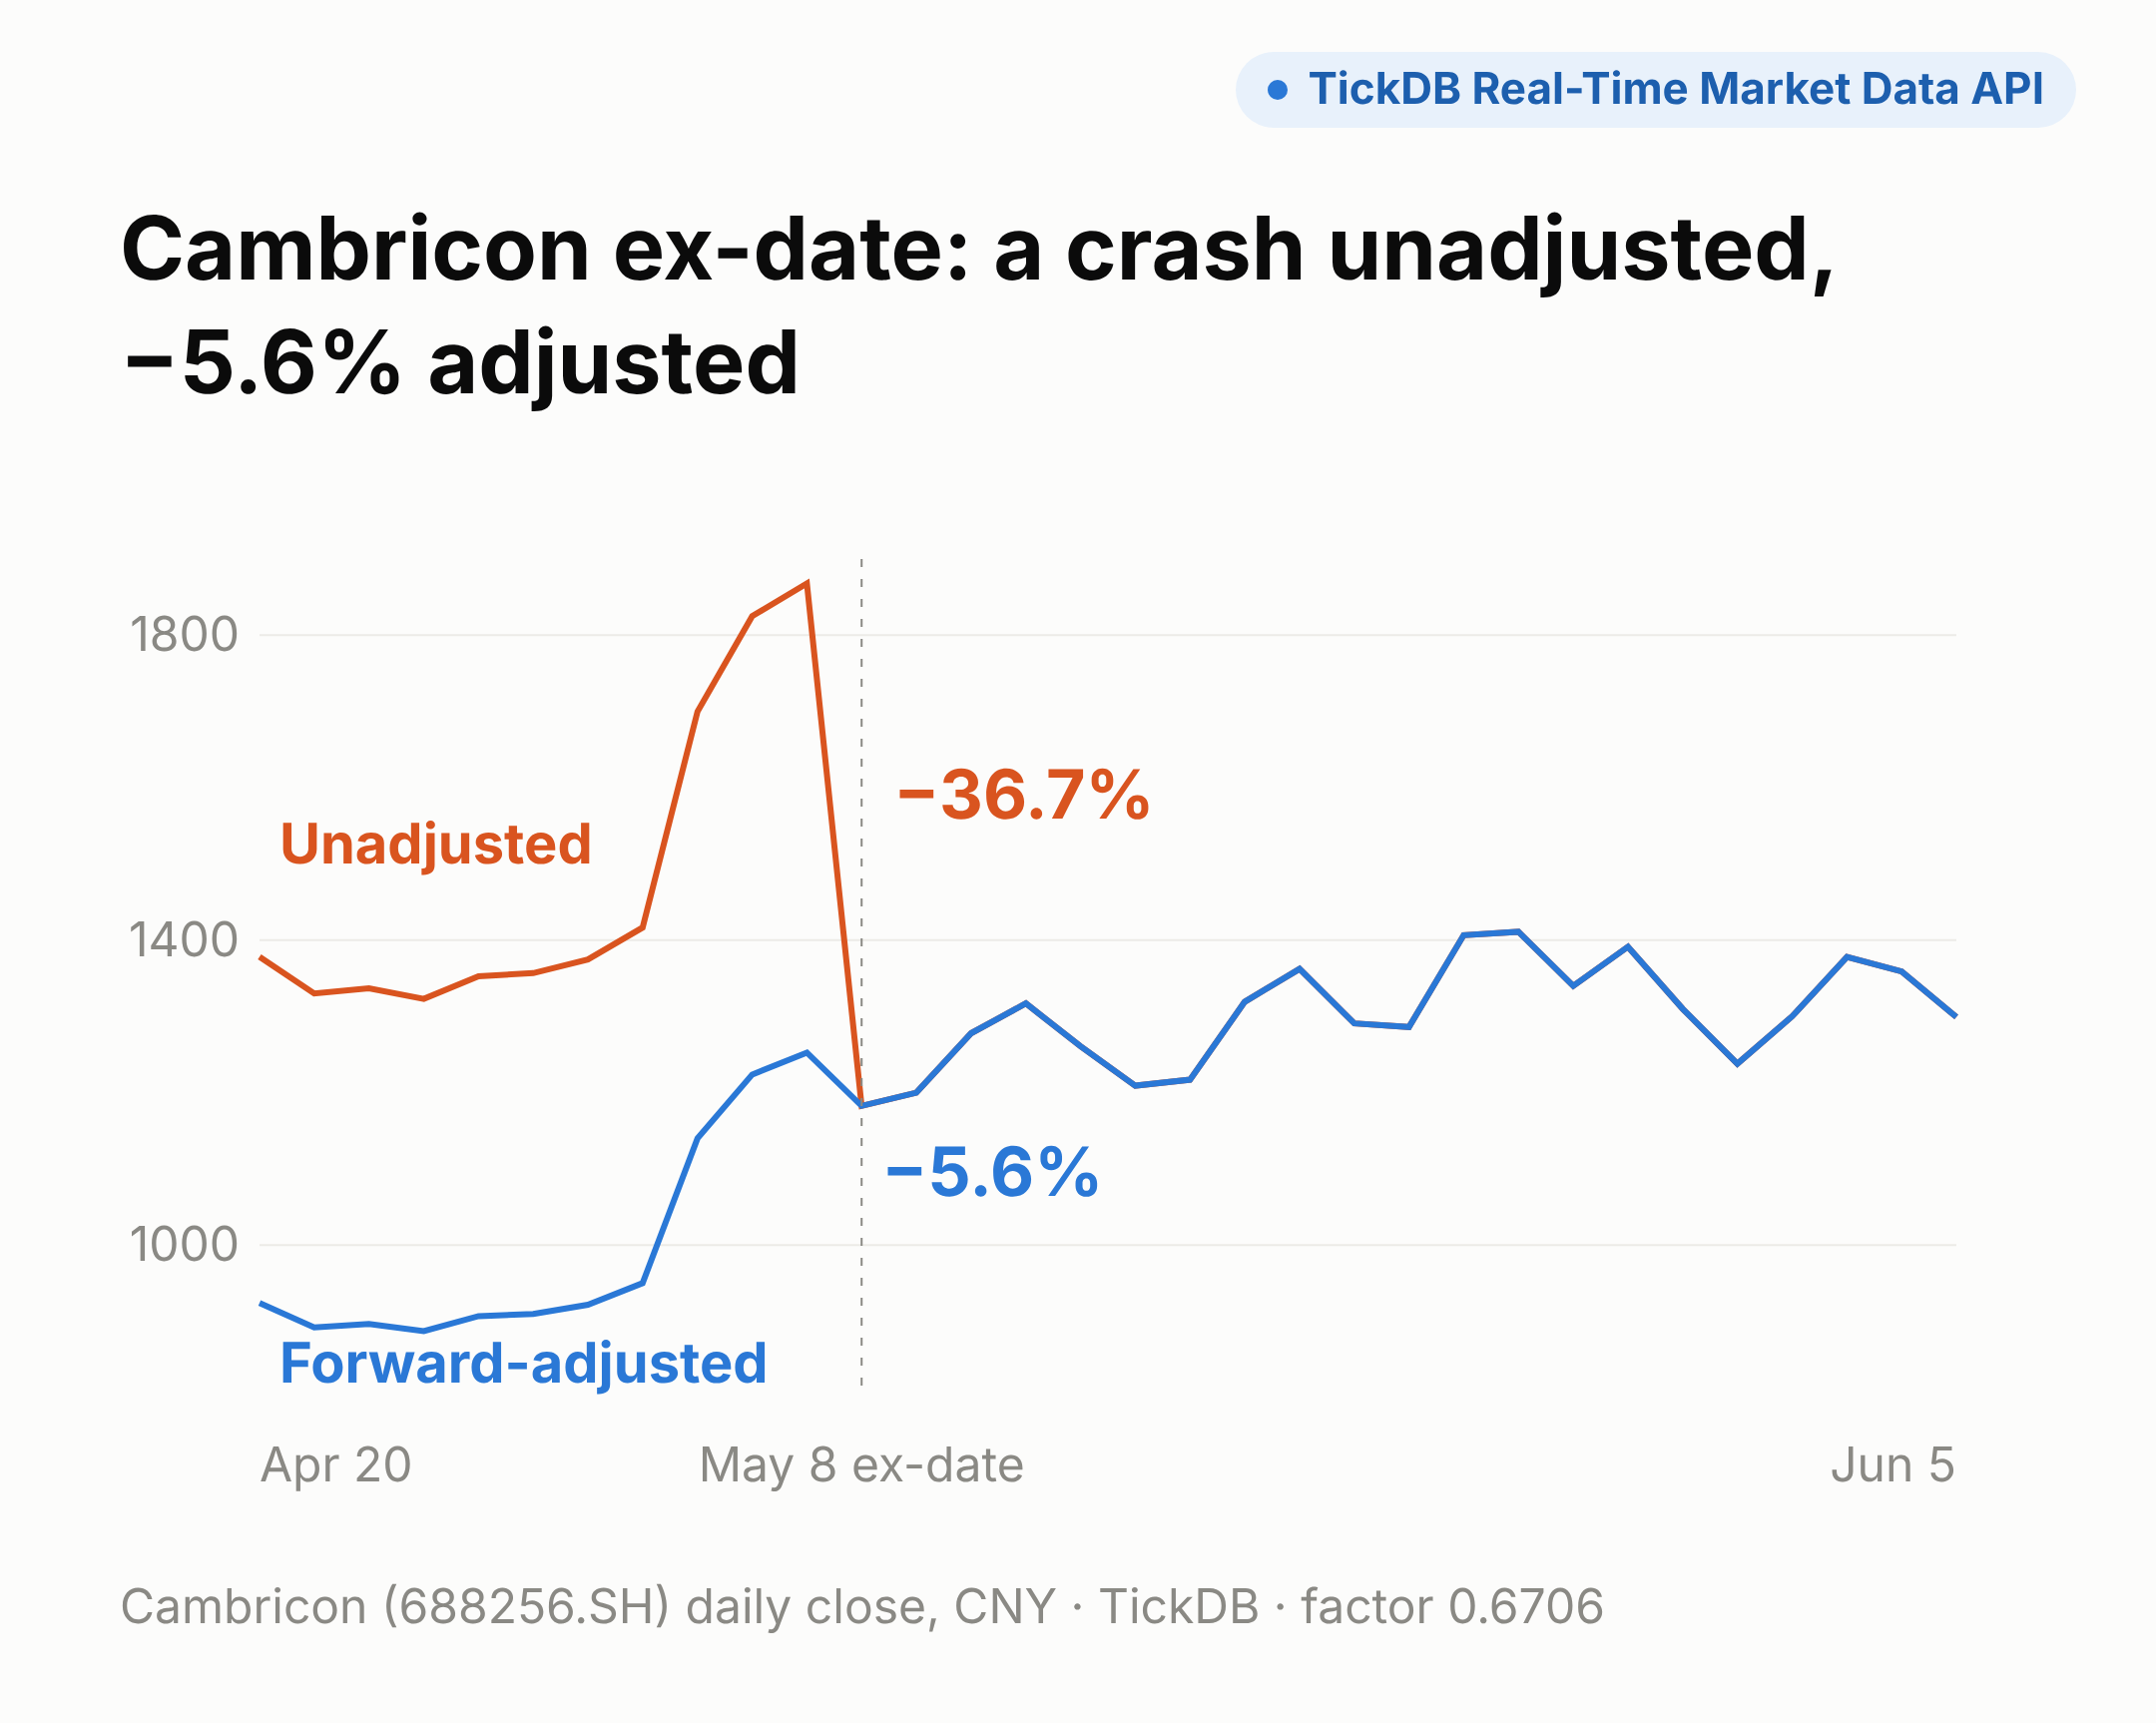
Forward-adjusted, the prior close becomes ¥1,252.68 and the day's real move is −5.6%. Without adjustment, moving averages and indicators break at that point, and percentage-based price alerts fire for nothing.
Fix: use forward-adjusted prices for charts. For backtests, record the adjustment method, because every new corporate action shifts the whole forward-adjusted history.
⑤ USD/CNH at 6.69916 shows as 6.70
Lightweight Charts keeps two decimal places by default. Fine for stocks, not for FX, where a day's move often sits in the third decimal.
Fix: set precision by instrument: five decimals for FX, two for stocks, three for low-priced Hong Kong stocks.
4. Intraday charts
⑥ The A-share intraday chart starts at 01:45
The same UTC problem, but more obvious intraday: 09:45 shows as 01:45 and the 15:00 close as 07:00.
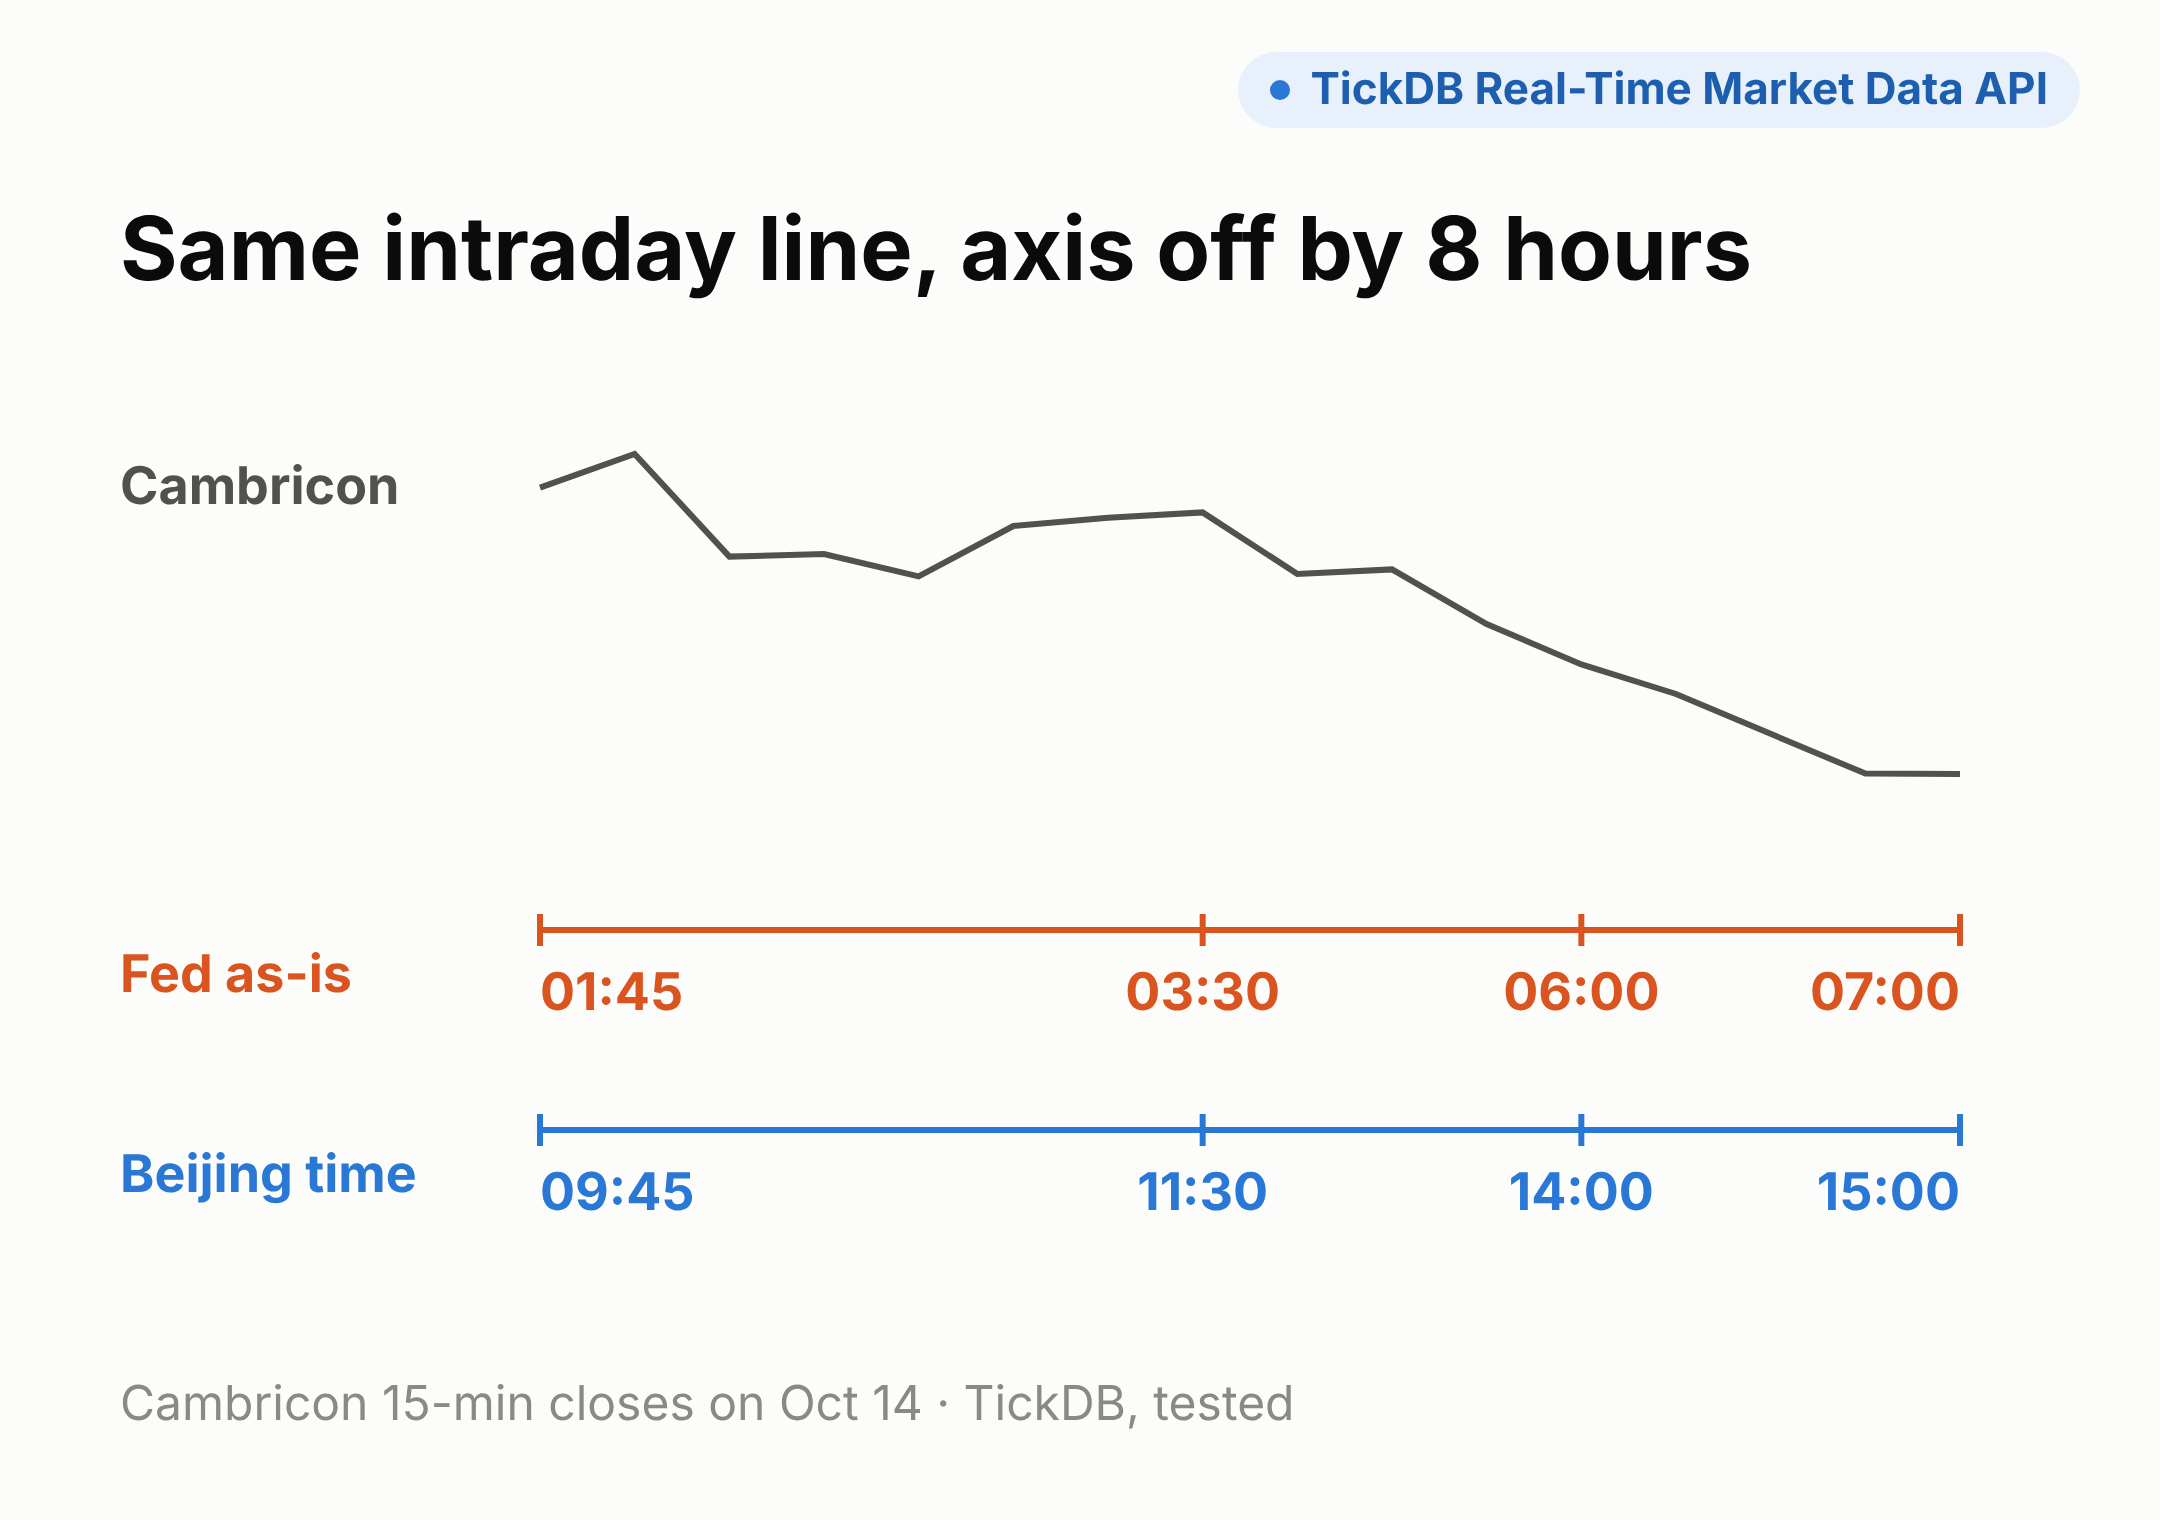
Fix: use the chart's time formatting options with IANA time zone names: Asia/Shanghai for A-shares, America/New_York for US stocks. Don't write "add 8 hours".
⑦ After November 1, US times are an hour off
A lot of code converts New York times with a fixed UTC−4. That's right during daylight saving time. After November 1, New York is UTC−5.
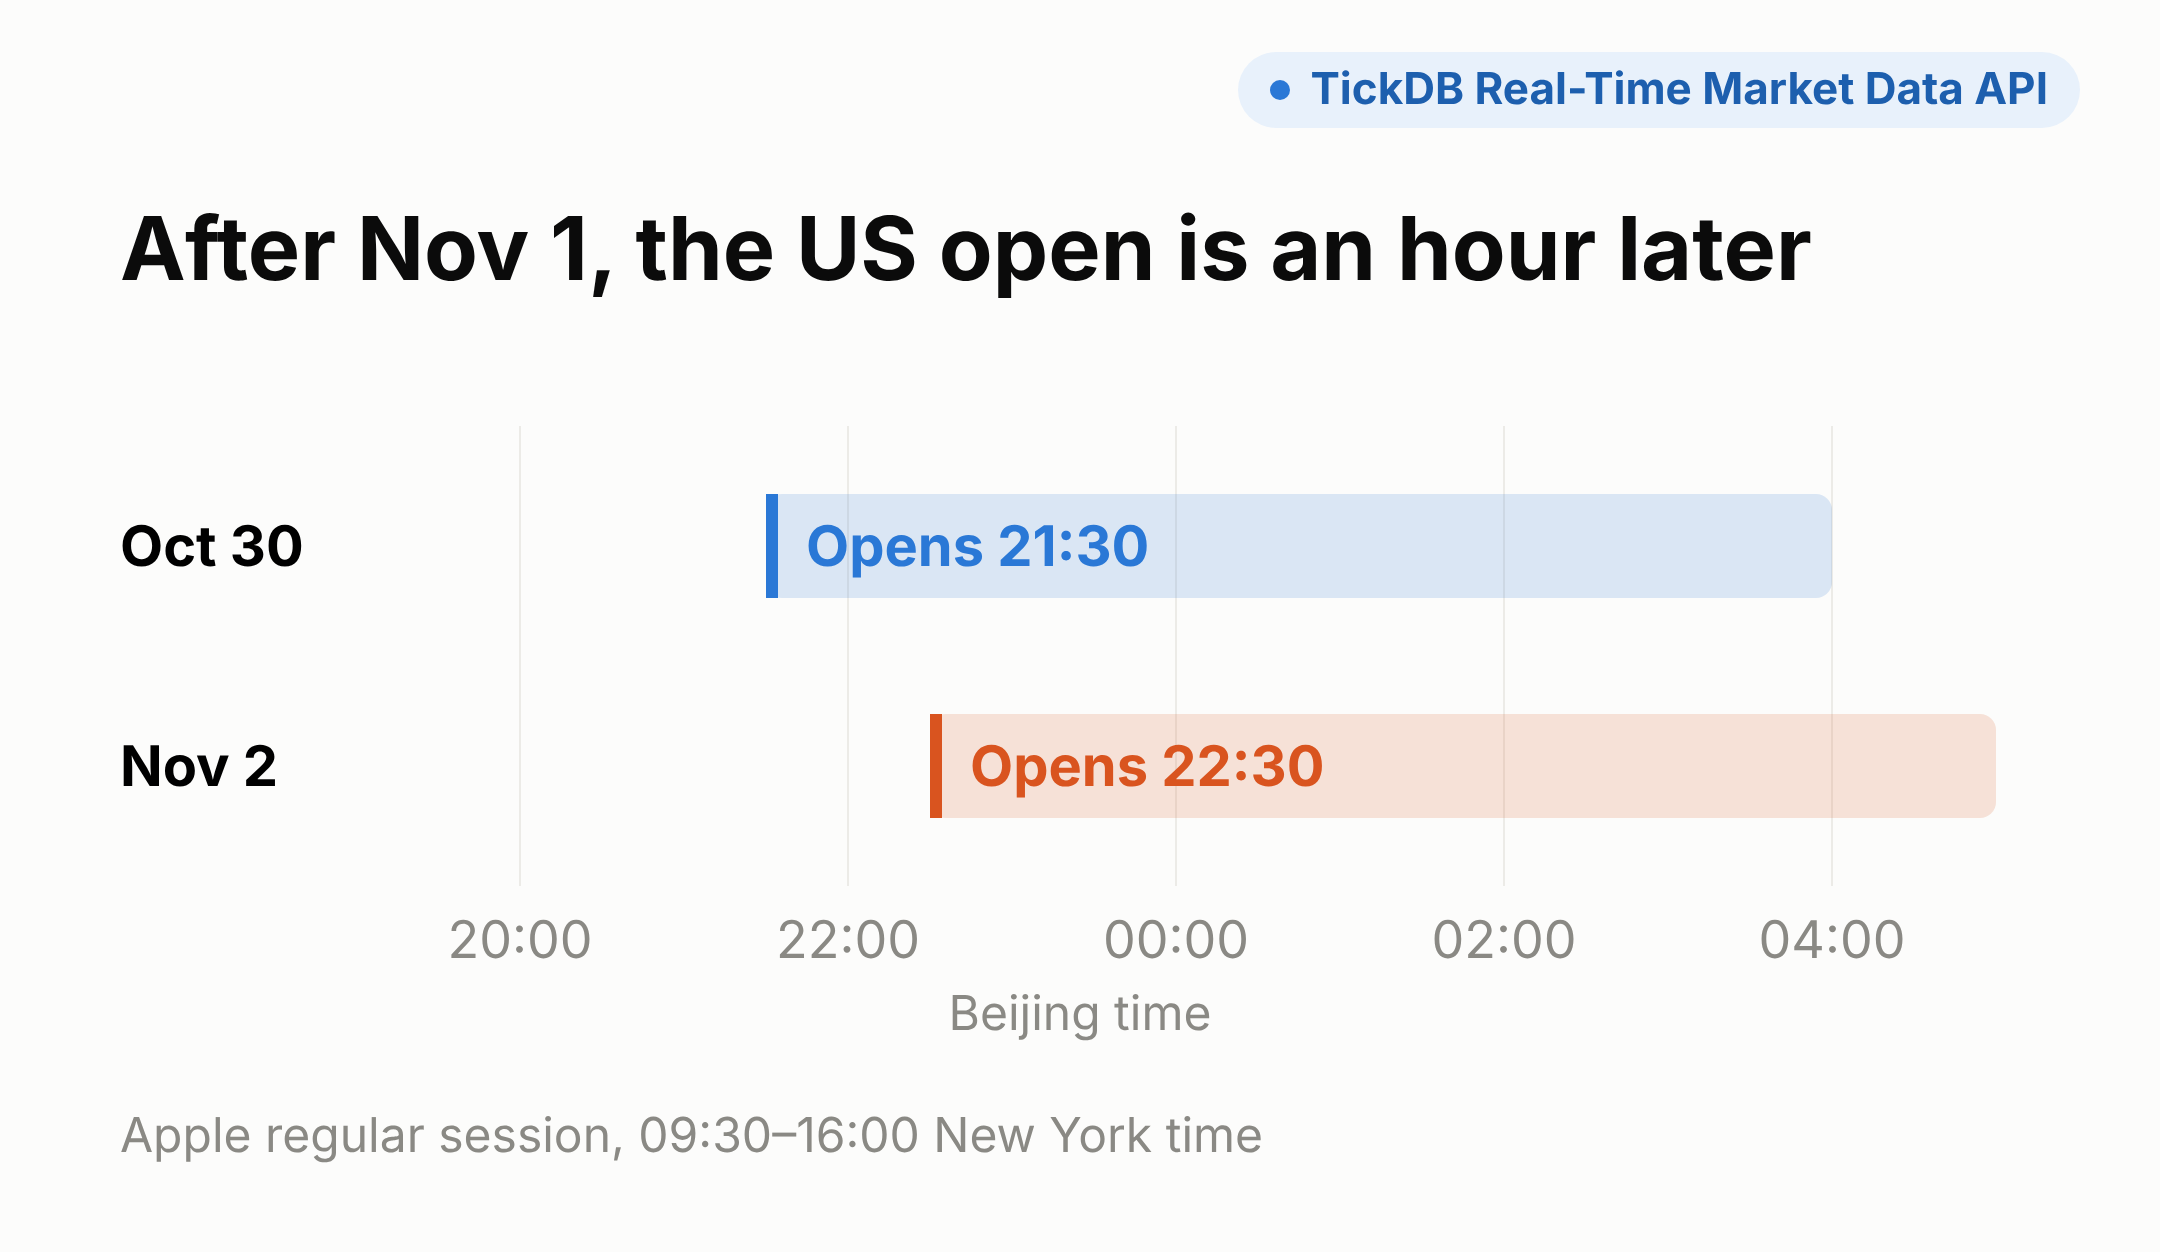
With a hard-coded offset, the open, the close and the "market open" badge are all an hour early. And if Hong Kong drops its lunch break, every chart that assumes a 12:00–13:00 gap needs changing too.
Fix: convert with time zone names and let the system handle daylight saving. Read trading sessions from an API instead of hard-coding them, so an exchange schedule change doesn't need a release.
⑧ The last candle looks like volume fell 60%
At 23:33 Beijing time, Apple's latest daily bar showed 14.82 million shares against 38.98 million the day before. The bar simply hadn't closed. The session had been open for about two hours.
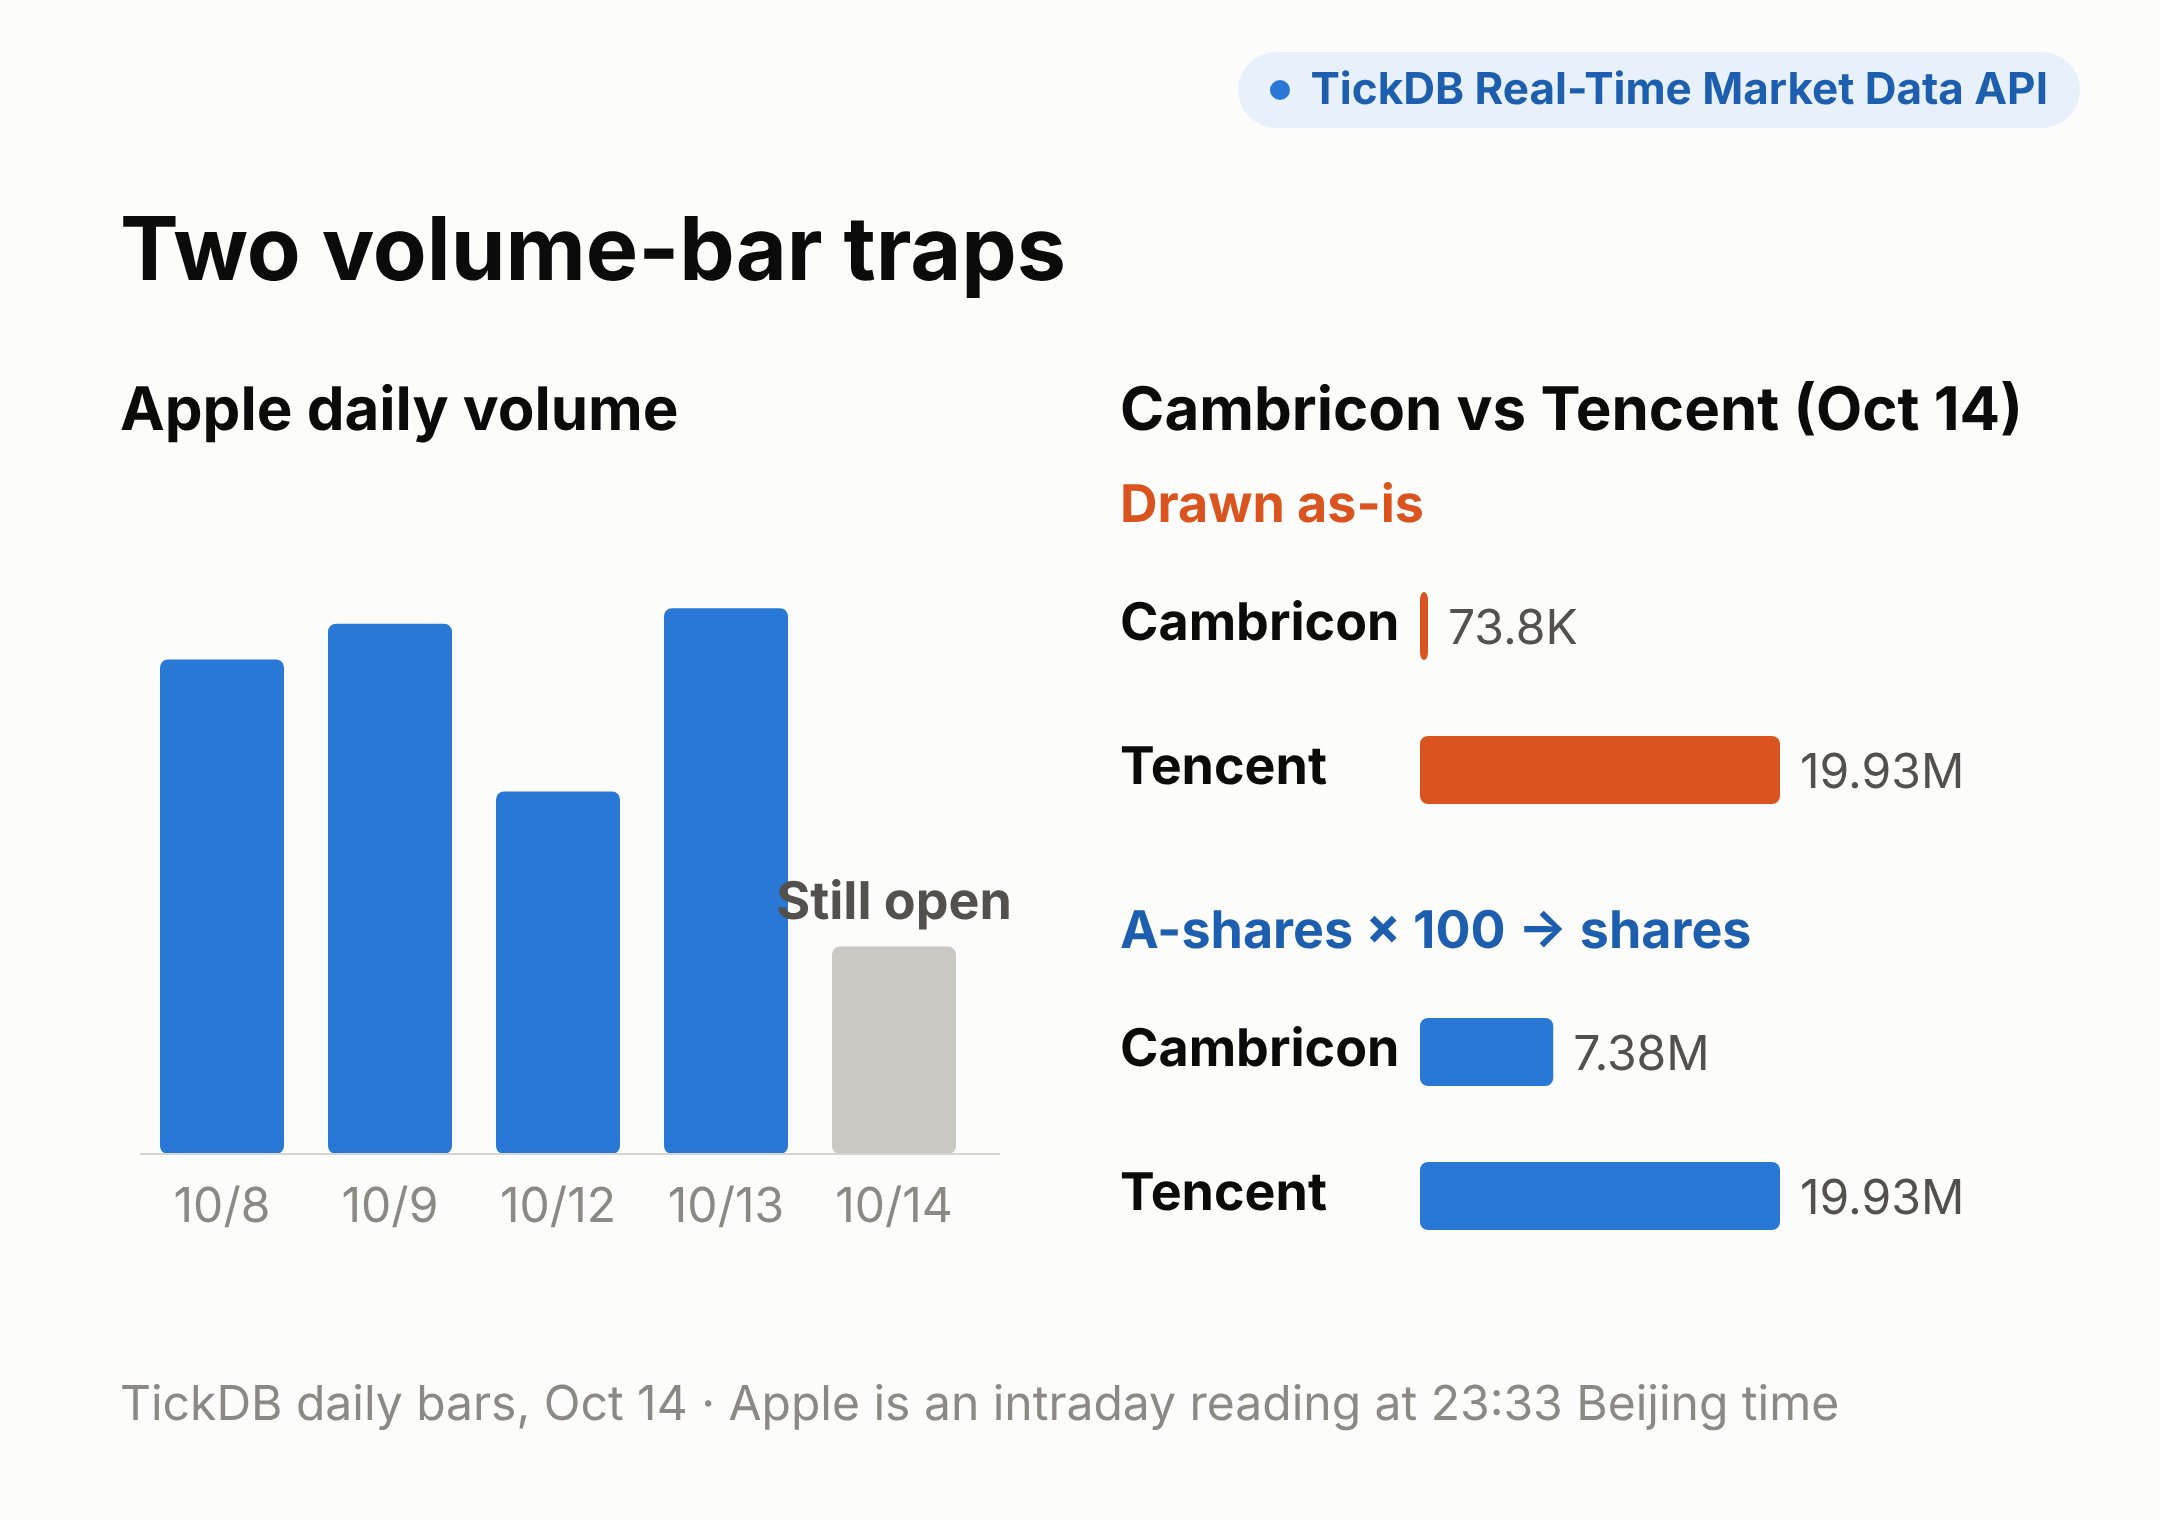
Volume signals, moving-average crossovers and alerts all get pulled around by this half-finished bar. Use it in a strategy signal and the backtest looks fine while live trading doesn't.
Fix: mark the last bar as "forming" and draw it lighter. Update it with series.update(). Feed indicators and alerts only closed bars.
5. Volume and launch day
⑨ Cambricon's volume bar is 1/270 of Tencent's
On October 14, Cambricon's volume was 73,781, in lots; Tencent's was 19,933,548, in shares. Side by side, Cambricon's bar nearly disappears. Multiplied by 100, it's 7.38 million shares, about 37% of Tencent's.
Fix: multiply A-share volume by 100 to get shares. To compare activity across markets, turnover is more reliable.
⑩ The date says year 58709, or the chart is blank
These are the two most common "the chart is gone" moments on launch day:
- Milliseconds not converted to seconds: most APIs return milliseconds; Lightweight Charts expects seconds. Feed milliseconds and nothing throws. The axis just reads "58709" and every candle is squeezed into one corner.
- Data not sorted: the library requires strictly ascending, unique times. Out of order, the chart goes blank, and the production build only logs
Value is null, which is hard to trace.
One compliance note: the small logo in the bottom-left corner is the attribution the open-source license asks for. If you turn it off, add the TradingView attribution and link elsewhere on the page.
Fix: convert milliseconds to seconds, sort ascending, and drop duplicate times. All three belong in the feed layer.
6. Pre-launch checklist
| # | What users see | Fix |
|---|---|---|
| ① | Daily bars a day early | Feed local date strings for daily bars |
| ② | Same day misaligned across markets | Convert to each market's trading date, then align |
| ③ | Up and down colors reversed | Set colors by user region |
| ④ | Ex-date looks like a crash | Use forward-adjusted prices for charts |
| ⑤ | FX shows two decimals | Set precision by instrument |
| ⑥ | Intraday axis starts at 01:45 | Format with exchange time zone names |
| ⑦ | US times off by an hour after DST | Use time zone names, read sessions from an API |
| ⑧ | Last bar looks like a volume drop | Mark it forming, keep it out of indicators |
| ⑨ | A-share volume bars 100× too short | Multiply by 100, or compare turnover |
| ⑩ | Year 58709, blank chart | Convert to seconds, sort, dedupe, keep attribution |
7. The fix: one data feed layer
All ten fixes live in the same place: before data reaches the chart. Don't patch each page separately. Write one feed layer and send every series through it.
Feed layer code
This code ran against the real data in this article with Lightweight Charts 5.2.1:
// feed.js: every candle series passes through here before it reaches the chart
const TZ   = { CN: 'Asia/Shanghai', HK: 'Asia/Hong_Kong', US: 'America/New_York', CRYPTO: 'UTC', FX: 'UTC' };
const LOT  = { CN: 100, HK: 1, US: 1, CRYPTO: 1, FX: 1 };   // A-share volume is in lots; x100 = shares
const DIGI = { CN: 2, HK: 2, US: 2, CRYPTO: 2, FX: 5 };      // price decimals; override for low-priced HK stocks

const dayOf = (ms, tz) =>                                   // exchange-local date 'YYYY-MM-DD'
  new Intl.DateTimeFormat('en-CA', { timeZone: tz, year: 'numeric', month: '2-digit', day: '2-digit' })
    .format(new Date(ms));

function normalize(klines, { market, interval, lastIsForming = false }) {
  const tz = TZ[market];
  const daily = /^(1d|1w|1M)$/.test(interval);
  const rows = klines
    .map(k => ({ ms: Number(k.time), o: +k.open, h: +k.high, l: +k.low, c: +k.close,
                 v: +k.volume * LOT[market], amt: k.quote_volume == null ? null : +k.quote_volume }))
    .filter(r => Number.isFinite(r.ms) && Number.isFinite(r.c))
    .sort((a, b) => a.ms - b.ms);                           // never assume the API's order
  const out = [];
  for (const r of rows) {
    const time = daily ? dayOf(r.ms, tz) : Math.floor(r.ms / 1000);   // dates for daily, seconds intraday
    const bar = { time, open: r.o, high: r.h, low: r.l, close: r.c, volume: r.v, amount: r.amt };
    if (out.length && out[out.length - 1].time === time) out[out.length - 1] = bar;  // keep the later duplicate
    else out.push(bar);
  }
  if (lastIsForming && out.length) out[out.length - 1].forming = true;  // still open: keep out of indicators and alerts
  return out;
}

function chartOptions(market) {
  const tz = TZ[market];
  const hm  = new Intl.DateTimeFormat('en-GB', { timeZone: tz, hour: '2-digit', minute: '2-digit', hourCycle: 'h23' });
  const ymd = new Intl.DateTimeFormat('en-CA', { timeZone: tz, year: 'numeric', month: '2-digit', day: '2-digit' });
  const fmt = t => typeof t === 'number' ? `${ymd.format(new Date(t * 1000))} ${hm.format(new Date(t * 1000))}` : t;
  return {
    layout: { attributionLogo: true },                       // keep attribution, or add NOTICE and link elsewhere
    localization: { timeFormatter: fmt },
    timeScale: { timeVisible: true,
                 tickMarkFormatter: t => typeof t === 'number' ? hm.format(new Date(t * 1000)) : null },
  };
}

function seriesStyle(market, region = 'US') {
  const [up, down] = region === 'CN' ? ['#e5484d', '#16a34a'] : ['#16a34a', '#e5484d'];
  const d = DIGI[market];
  return { upColor: up, downColor: down, wickUpColor: up, wickDownColor: down, borderVisible: false,
           priceFormat: { type: 'price', precision: d, minMove: 10 ** -d } };
}

function safeUpdate(series, bar) {                           // ignore out-of-order pushes
  const last = series.data().at(-1);
  if (last && bar.time < last.time) return;                  // date strings and seconds both compare directly
  series.update(bar);
}
Usage:
// resp: kline response proxied through your backend; the API key stays server-side
const bars    = normalize(resp.data.klines, { market: 'CN', interval: '1d', lastIsForming: true });
const chart   = LightweightCharts.createChart(el, chartOptions('CN'));
const candles = chart.addSeries(LightweightCharts.CandlestickSeries, seriesStyle('CN', 'CN'));
candles.setData(bars);
Cross-market apps work best with one API
Branching by market is unavoidable: A-shares trade in lots and Hong Kong in shares, and that's a market rule. Branching by data provider is avoidable. Wire up a separate provider for each of A-shares, Hong Kong, US stocks, crypto and FX, and each one brings its own timestamp format, field names and adjustment parameters, and any one of them can break your conversion when it upgrades.
TickDB provides a unified global market data API for developers and AI applications, giving teams real-time and historical data across major markets — including US, Hong Kong and China A-shares — through a single integration, so they can ship market data, analytics and monitoring products faster.
All data in this article came from TickDB's kline endpoint. Three things matter for the feed layer:
- Klines for A-shares, Hong Kong, US stocks, FX and crypto share one set of fields, so the feed layer only branches by market.
- One
adjustparameter switches stock klines between unadjusted, forward-adjusted and backward-adjusted. - A trading sessions endpoint returns each market's local session times, so open and close never need to be hard-coded.
One last check
Open your chart, hover over the latest candle, and see whether the date is today. Then find a stock with a recent corporate action and look at its ex-date. Two minutes tells you whether you're hit by ① and ④.
Hong Kong's longer hours are still under discussion, and US daylight saving ends in two weeks. Trading hours change, adjustment factors change. Handle those changes in the feed layer, not scattered across every chart.
References
All accessed October 14–15, 2026.
- Finance Magnates, HKEX May Scrap Lunch Break and Open Stock Trading Earlier, September 23, 2026
- 21st Century Business Herald, SFC: discussion paper on extending trading hours (in Chinese), October 10, 2026
- TradingHours.com, Nasdaq Trading Hours
- TradingView, Welcome the newest Lightweight Charts™ — version 5
- Earlier in this series: Building a Multi-Market Stock Dashboard: 7 Things That Break After the Demo; Same Gold Price, −0.69% or +0.24%: Why % Change Breaks in Cross-Market Data Apps