How to Evaluate A-Share Tick Data Quality? From Real-Time Subscription to Historical Detail Reconciliation
TickDB Research ·
How to Evaluate A-Share Tick Data Quality? From Real-Time Subscription to Historical Detail Reconciliation
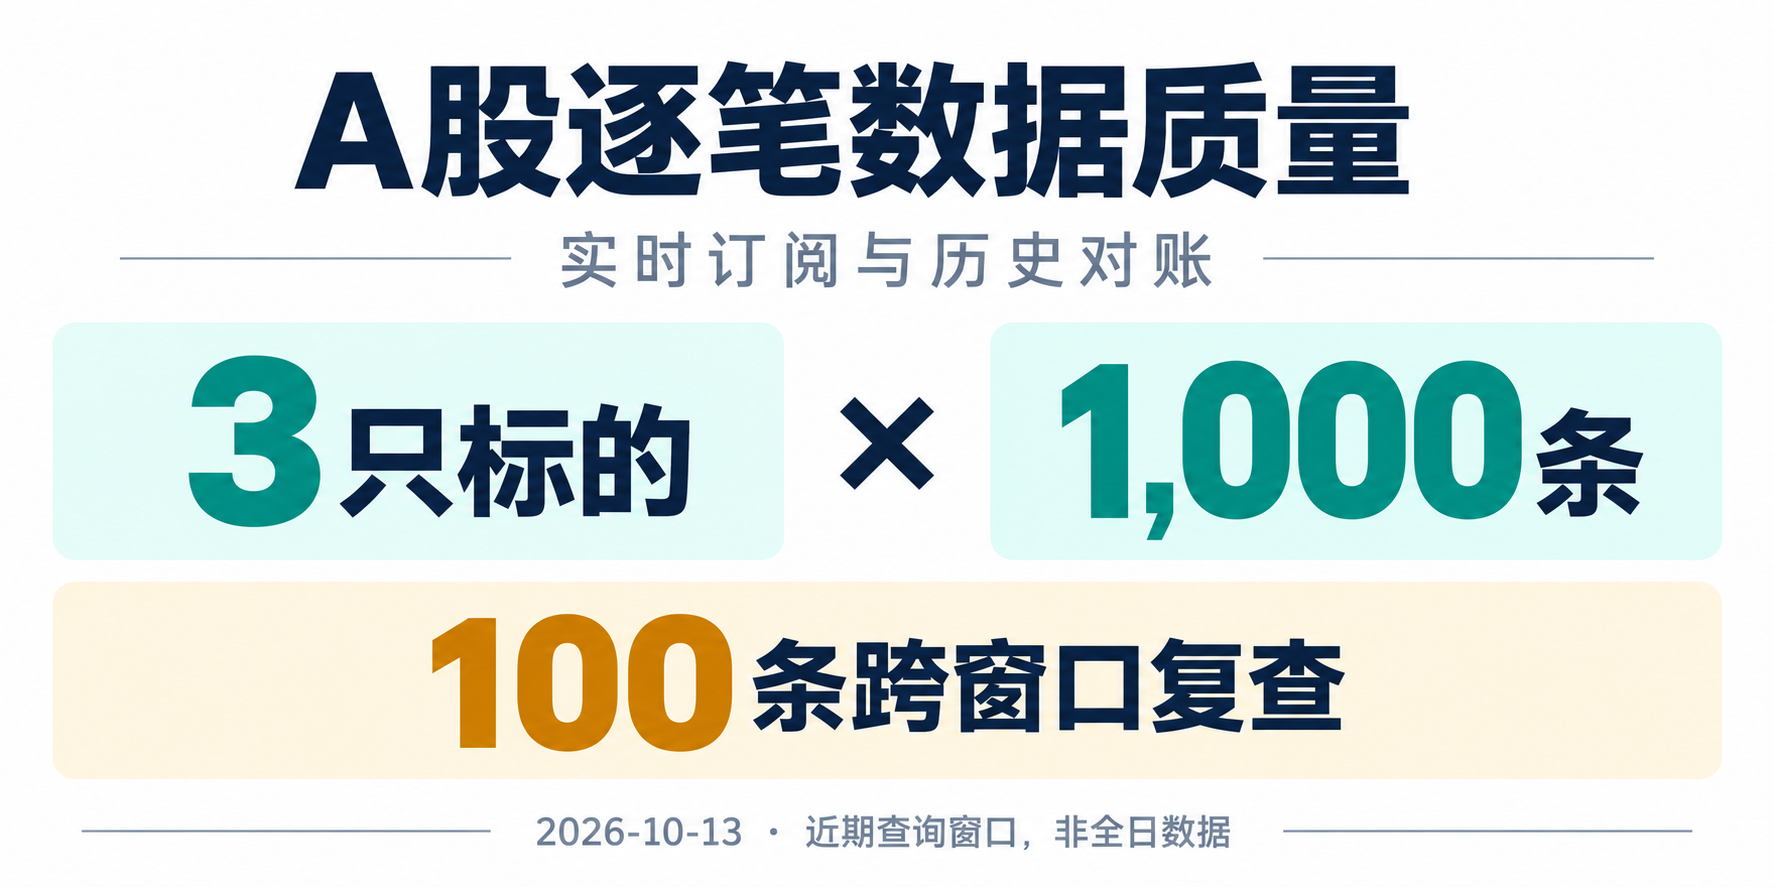
The API returned success, all fields are present, and the trade prices look normal—does that mean the tick data is ready for historical analysis? Not quite. The same trade may receive different IDs across two queries, the side field may contain values beyond the documented enum, and the most recent 1,000 records may not cover the entire trading session.
This article uses actual trade detail queries for Zhongji Xuchuang, Xin Yi Sheng, and CATL as examples to break down data quality into actionable checks, and explains how to connect real-time subscription persistence with historical verification. This verification was completed on the evening of October 13, 2026; the tested targets were the most recent trading windows, without conducting intraday WebSocket collection or obtaining full-day ticks for any historical date.
First, Define What "Historical Details" Actually Mean
Real-time subscription answers "which records were received during the connection"; recent trades query answers "what are the most recent N records currently available"; date-filtered historical ticks answer "are records complete for the specified date and interval". These three cannot substitute for each other.
The REST documentation reviewed provides symbol, limit, and type parameters, with limit maximum 1,000 and no date range or pagination cursor documented. Therefore, historical analysis here is divided into two layers: actually verifying the most recent trading window; designing the system to continuously persist real-time messages and build traceable history day by day. Do not invent start, end, or cursor parameters for the first type of interface, and do not conclude that all products of the service lack historical tick capability just because certain parameters are not found.
A finer layer is the source granularity of "tick": whether one API record corresponds to one raw exchange trade, or is derived from snapshot differencing, merging, or other processing, requires separate confirmation. Field names and record counts alone cannot prove it is the complete exchange tick stream.
Build Sample with Three Active Instruments
Three actively traded ChiNext stocks were selected as cases. Connector snapshots show that on that day, cumulative trading turnover for Zhongji Xuchuang, Xin Yi Sheng, and CATL was approximately 22.113 billion, 14.614 billion, and 11.907 billion yuan respectively. This is only the basis for sample selection, not a recalculated popularity ranking across the entire market; three samples also cannot represent all A-share sectors.
For each stock, call the recent trades query once with limit=1000 and save the raw response. All times below are converted to Beijing time, and dates are 2026-10-13.
| Instrument | Sample Time Range (1,000 records each) | Unknown side records |
|---|---|---|
| Zhongji Xuchuang 300308.SZ | 14:08:51—15:30:00 | 35 records / 3.5% |
| Xin Yi Sheng 300502.SZ | 14:09:12—15:30:00 | 42 records / 4.2% |
| CATL 300750.SZ | 14:08:24—15:30:00 | 26 records / 2.6% |
Across the three samples, no null values were found in price, quantity, timestamp, or side; prices and quantities are all positive; no time reversal was found in response order, and no duplicate IDs within a single response. These are check results within the samples and cannot be used to give conclusions about full-day completeness or "zero packet loss."
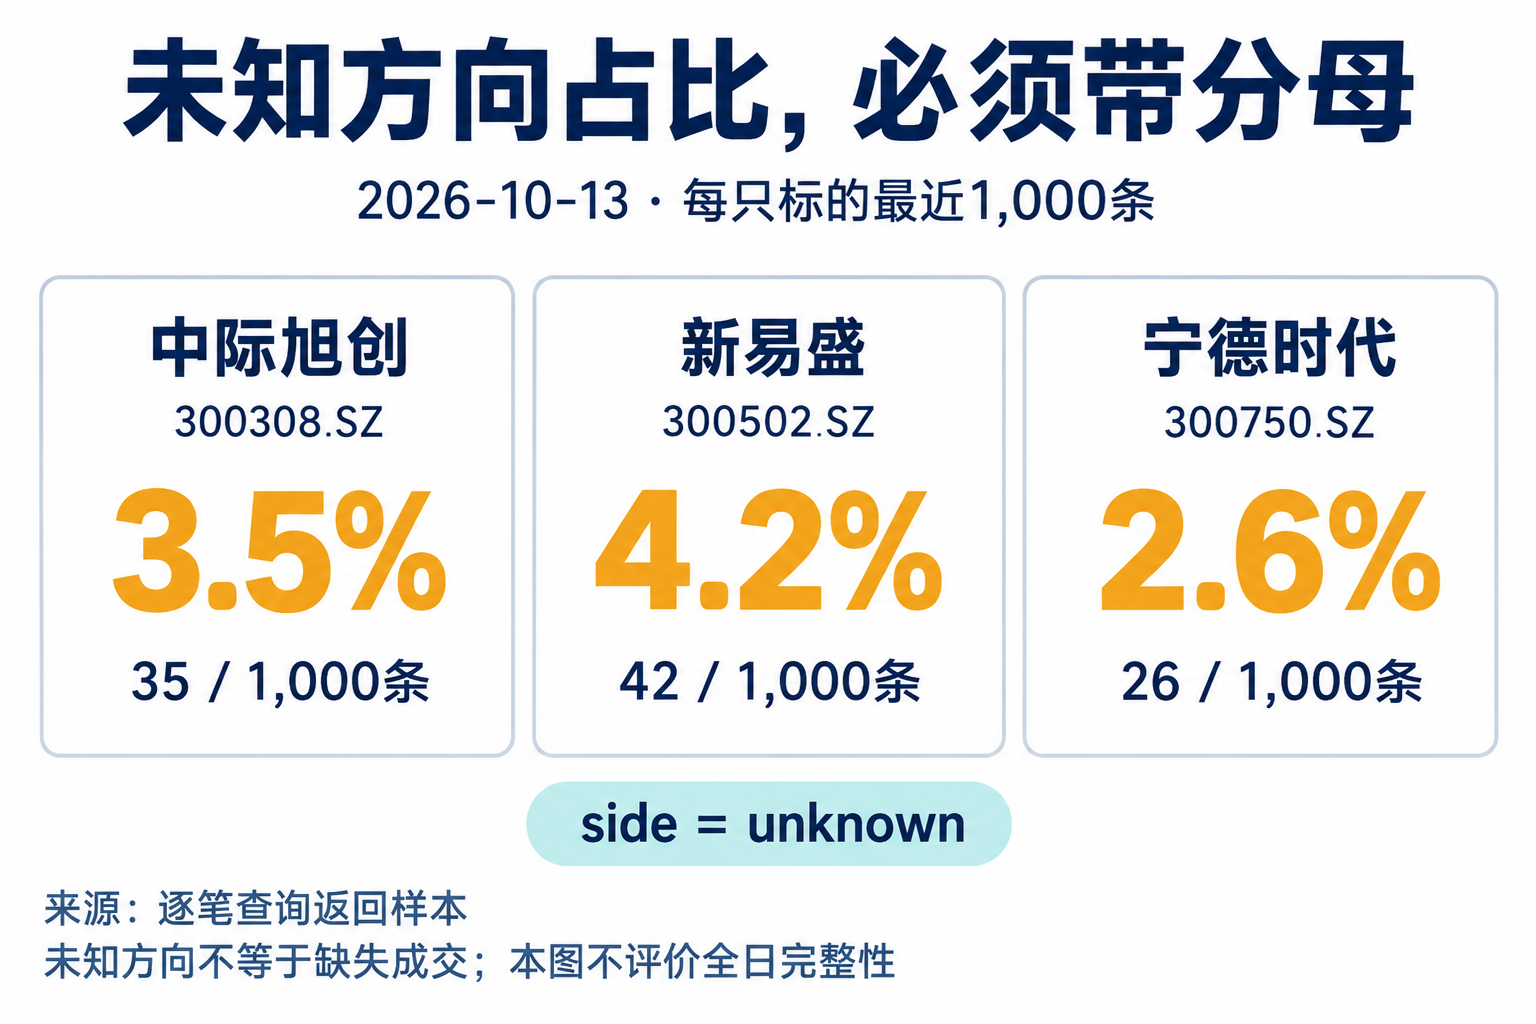
Figure 1: In the recent query windows on 2026-10-13, unknown side records for Zhongji Xuchuang, Xin Yi Sheng, and CATL are 35/1,000, 42/1,000, and 26/1,000 respectively. Unknown side does not equal missing trades; these proportions cannot be used to evaluate full-day completeness.
Dimension One: Fields Valid, Business Meaning Must Also Hold
The documentation lists trade direction as buy, sell, or neutral, but the actual response also contains unknown. A client strictly parsing only three enum values may error; automatically converting unknown to neutral changes "unknown" to "neutral," altering the analysis scope.
Recommendation: preserve side_raw and mark unexplainable directions as unknown. When calculating direction proportions, also report the unknown rate; calculations requiring side should only use records with known direction and clearly define the denominator. The 3.5%, 4.2%, and 2.6% in this article all use their respective 1,000 records as denominators. The method for determining buy/sell also needs verification and cannot be directly interpreted as real capital inflow or outflow.
The quantity field also cannot be verified by simply checking "can be converted to integer." The tick pages read only state "trade quantity" without specifying the unit for A-share quantity. The raw totals in this review are 37,323, 52,721, and 69,111 respectively, but before confirming "shares, lots, or other units," they should not be written as trade share counts or used to calculate trade value. Furthermore, the quantity in this tail window should not be divided by the full-day snapshot volume to claim a data completeness rate.
There is another easily overlooked detail with price: raw responses contain long decimals like 734.1199951171875. Checking against the 0.01 grid, 859, 929, and 953 records in the three samples respectively do not land exactly on the grid. This is consistent with floating-point representation error, but the response alone cannot confirm the service's internal implementation.
When processing, keep the original string and use Decimal for calculation; display values can be handled according to verified price tick levels, but the original value should not be overwritten. Decimal avoids introducing additional binary floating-point arithmetic errors but cannot recover precision already lost upstream. Automatic rounding should not mask true anomalous quotes.
Dimension Two: Time Valid Does Not Equal Correct Granularity
Across the three samples, there are 999 pairs of adjacent records each, with intervals exactly 3 seconds in 963, 956, and 972 pairs respectively, accounting for 96.40%, 95.70%, and 97.30%. This pronounced regularity warrants further confirmation of upstream sampling or aggregation method.
This is not a measurement of "3-second latency," nor can it be concluded that only one trade occurs every 3 seconds. Currently there is only event time, without real-time receive time, exchange sequence, or an independent complete reference stream. Using these records directly for order flow reconstruction or tick-by-tick microstructure backtesting lacks sufficient evidence.
Also, records after 15:00 should not be automatically treated as dirty data. The Shenzhen Stock Exchange's "Trading Rules (2026 Revision)" specifies a post-closing fixed price trading session from 15:05 to 15:30. In this review, 36, 43, and 27 records in the three samples respectively have timestamps later than 15:00; time rules should be determined in combination with the security, date, and session. Trading rules can explain the existence of post-closing sessions but cannot independently prove that every returned record is a real and correctly classified post-closing trade.
During real-time collection, save event_ts and received_at separately. The difference between them can only be called "observed data age," which also includes clock skew, upstream processing, and local queuing; without clock calibration and link decomposition, it should not be called pure network latency. When executing historical queries after market close, query time minus trade time certainly cannot be treated as real-time latency.
Dimension Three: IDs Unique Within a Single Response, Stable Across Windows?
For Zhongji Xuchuang, another query with limit=100 was executed; the 100 trades in the result completely match the tail of the previous 1,000-record response, but all corresponding IDs are different.
For example, a record with timestamp 1791874431000, price 734.1199951171875, quantity 20, and side sell has ID 1791874431000_900 in the larger window but becomes 1791874431000_0 in the smaller window. This is an observation from these two query windows and cannot be extrapolated to ID generation rules for all markets or all dates.
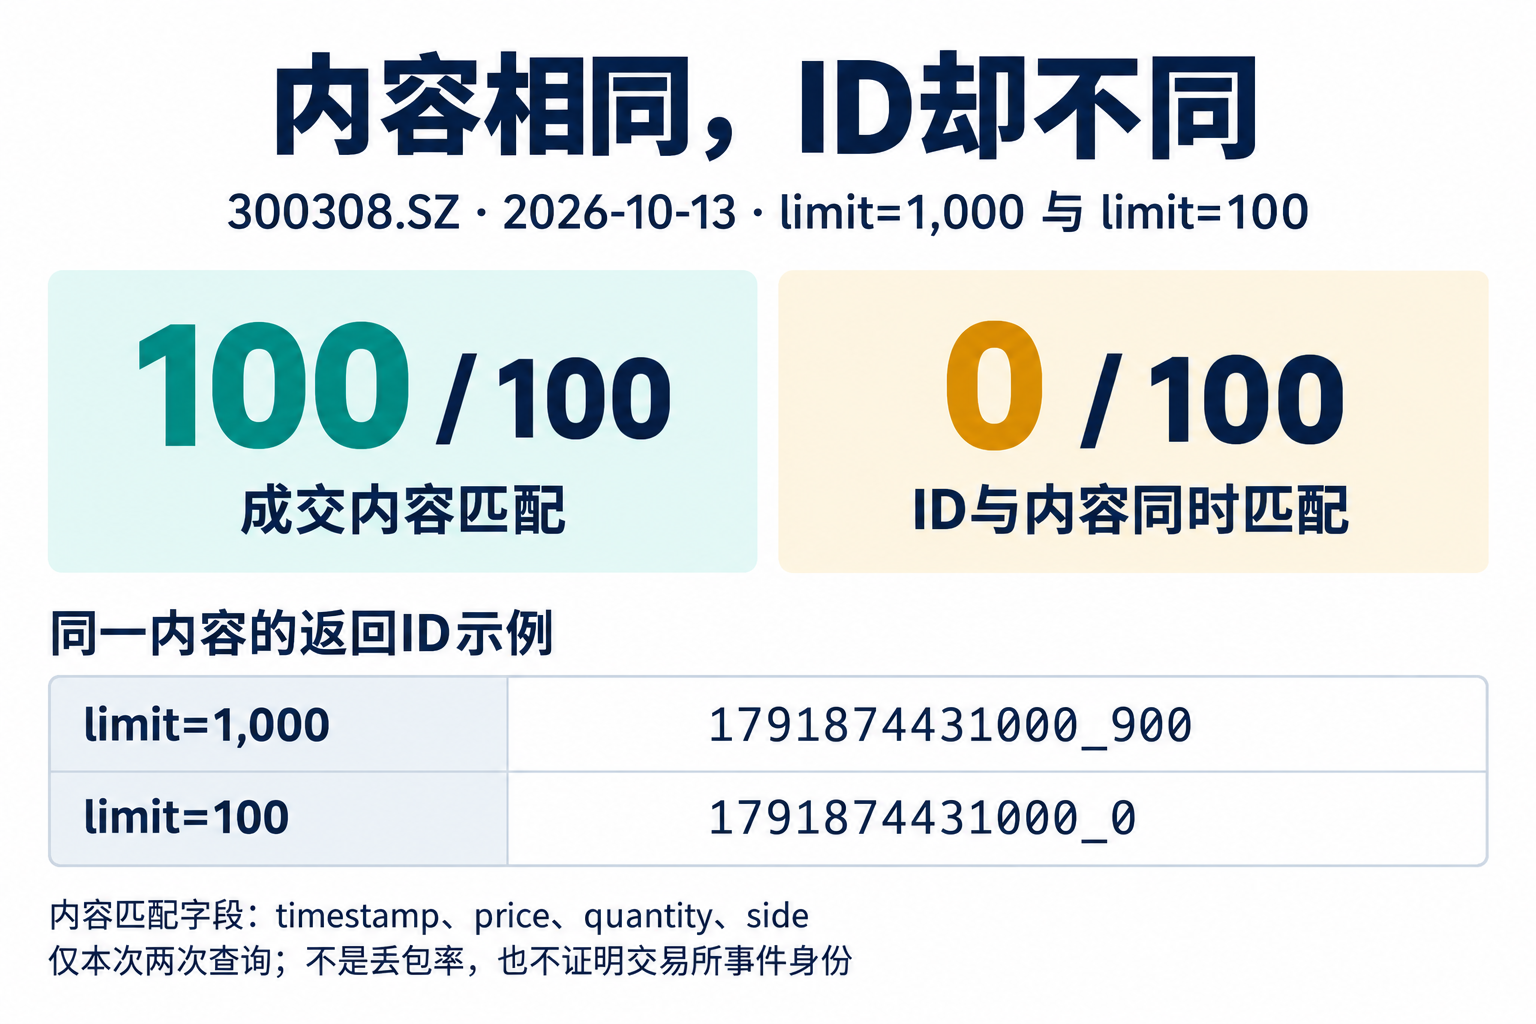
Figure 2: In the two queries for 300308.SZ, 100/100 trade contents match, but 0/100 IDs and contents match simultaneously. Example IDs are 1791874431000_900 and 1791874431000_0 respectively. Content comparison is based on timestamp, price, quantity, and side; this result is not a packet loss rate and cannot prove exchange event identity.
The direct engineering impact: if using id as a cross-request primary key, polling or backfilling may cause the same content to be double-counted; if using only timestamp as a primary key, it may overwrite legitimate trades occurring within the same millisecond.
A diagnostic fingerprint can first be created using "security + timestamp + price + quantity + side," with multiset comparison to count occurrences rather than direct set deduplication. Different real trades may still share the same fingerprint, so fingerprints can only assist reconciliation, not replace a stable exchange event identifier. At the raw layer, preserve request batch, connection session, and message sequence number; records with ambiguity should be marked for review and not silently deleted.
Write Observations as Reproducible Checks
Below is the recent window request example, using the official quick start with X-API-Key. A valid key and corresponding market data permissions are required; this review's actual queries were made through the connector, and this curl command was not directly executed on this machine.
curl --fail-with-body --get \
  'https://api.tickdb.ai/v1/market/trades' \
  -H "X-API-Key: ${MARKET_API_KEY}" \
  --data-urlencode 'symbol=300308.SZ' \
  --data-urlencode 'type=stock' \
  --data-urlencode 'limit=1000' \
  -o recent-1000.json
Change limit to 100 and save as recent-100.json. The following Python code compares the two successful responses, using Decimal to preserve decimal value semantics and Counter to preserve occurrence counts of identical content. This is diagnostic code and will not modify or deduplicate original records.
import json
from collections import Counter
from decimal import Decimal

def read(path):
    with open(path, encoding="utf-8") as f:
        obj = json.load(f)
    if obj.get("code") != 0:
        raise ValueError("Request failed")
    return obj["data"]["trades"]

def key(r):
    return (r["timestamp"], Decimal(r["price"]),
            Decimal(r["quantity"]), r["side"])

a = read("recent-1000.json")
b = read("recent-100.json")
x, y = Counter(map(key, a)), Counter(map(key, b))
print("payload overlap:", sum((x & y).values()))
x = Counter((r.get("id"), key(r)) for r in a)
y = Counter((r.get("id"), key(r)) for r in b)
print("id + payload overlap:", sum((x & y).values()))
After extracting the business JSON from the two saved raw responses and executing, output is 100 and 0 respectively. If executed intraday, the window will shift between the two queries; the overlapping time range should be confirmed first; a low overlap count alone cannot prove data loss. The attached script also统计字段、方向、乱序、重复内容和价格网格异常。
Building Verifiable History from Real-Time Subscription
The real-time endpoint and subscription message verified in this review are as follows. For A-share trade messages, single-record fields are directly under data; the parsing method for data.trades arrays from Hong Kong and US stocks cannot be directly copied; the A-share message examples in the documentation also lack IDs for cross-endpoint matching. This part was verified against documentation without completing live subscription testing.
import os
from urllib.parse import urlencode

ws_url = "wss://api.tickdb.ai/v1/realtime?" + urlencode({
    "api_key": os.environ["MARKET_API_KEY"]
})
subscription = {
    "cmd": "subscribe",
    "data": {"channel": "trade",
             "symbols": ["300308.SZ", "300502.SZ", "300750.SZ"]}
}
# Pass ws_url and subscription to a WebSocket client.
# Do not print ws_url: it contains a credential.
When persisting to database, first save the complete raw message and receive time, then generate standardized records. Connection success does not equal subscription success; subscription feedback and the first data record should be recorded; after reconnection, resubscribe and record the disconnection interval. Keep raw layer and analysis layer separate; parsing failures or unknown enums can be handled in isolation but should not be directly discarded.
For historical analysis, read persisted records by trading day and session, first confirm gaps, then calculate per-minute record counts, quantity, and price statistics. With consistent window, unit, granularity, and session, compare the record multisets of real-time persistence and historical query results; when a stable identifier exists, check event-level coverage. If B is the reference window and A is the local window, diagnostic match rate can be expressed as sum(min(A[k], B[k])) / sum(B[k]), but it is only the "match rate relative to the reference window." B may also have missing data, so it cannot be called the market's true completeness rate.
Disconnection backfilling is particularly constrained by the most recent N records limit: if the earliest time of the historical query is already later than the disconnection start time, the window is insufficient to verify the entire disconnection interval. Mark unverifiable intervals, use confirmed historical data channels to supplement, or exclude those intervals from completeness-sensitive analysis. Reconnection success should not be treated as automatic historical backfill.
What Conclusions Can This Data Provide
Current evidence supports three categories of conclusions: sample field and positive value checks passed; direction enum, price precision, and cross-window ID stability require adaptation or further verification; full-day completeness, exchange raw tick granularity, real-time data age, and real-time-to-historical consistency have not yet been measured.
For trade detail display, these records can be used to verify parsing and display logic; for quantity, turnover, or buy/sell direction analysis, first confirm units and direction definitions; for tick backtesting and order flow analysis, evidence of granularity, completeness, and event identity must still be obtained. Data quality acceptance results should be tied to specific use cases: which checks have passed, which statistics are limited, and which intervals remain unverifiable.