Choosing a US Historical Stock Data API: When Does a Backtest Need Minute Bars?
TickDB Research ·
Choosing a US Historical Stock Data API: When Does a Backtest Need Minute Bars?
Abstract: Historical data should match the information a backtest needs. Using AAPL daily data and 390 one-minute records from the same day, this article checks the order of two price-threshold observations, explains when daily bars can be sufficient, and shows how an unresolved volume discrepancy changes a data trial.
A backtest has two exit conditions: an upper price threshold and a lower one. The daily high exceeds the upper level, while the daily low falls below the lower level. Which happened first?
Buying a longer daily history will not recover that day's intraday path. Buying the finest available data immediately may also spend money on information the research does not yet need. Start by identifying the observation your decision requires.
What the daily bar left unresolved
The selected diagnostic sample is AAPL.US on October 26, 2026, in New York time, with no price adjustment. The original API responses were captured on November 15 and checked offline on November 16.
| Open | High | Low | Close |
|---|---|---|---|
| $343.92 | $347.09 | $341.03 | $343.91 |
We set teaching thresholds at $345.92 and $341.92: two dollars above and below the daily open. These are analytical settings, not investment recommendations or actual orders.
Both thresholds fall within the daily range. An upper-first and a lower-first path can each produce that range. Selecting one in a simulator introduces an execution assumption that the daily bar itself does not establish.
What the minute records added
The returned regular-session window contained 390 unique, consecutive minute labels from 09:30 to before 16:00. Scanning the sorted records produced:
| Threshold | First covering record label | That record's high / low |
|---|---|---|
| Upper: $345.92 | 09:30 | 346.215 / 343.42 |
| Lower: $341.92 | 09:45 | 342.38 / 341.83 |
No minute record in this window covered both thresholds. In these returned records, upper coverage preceded lower coverage.
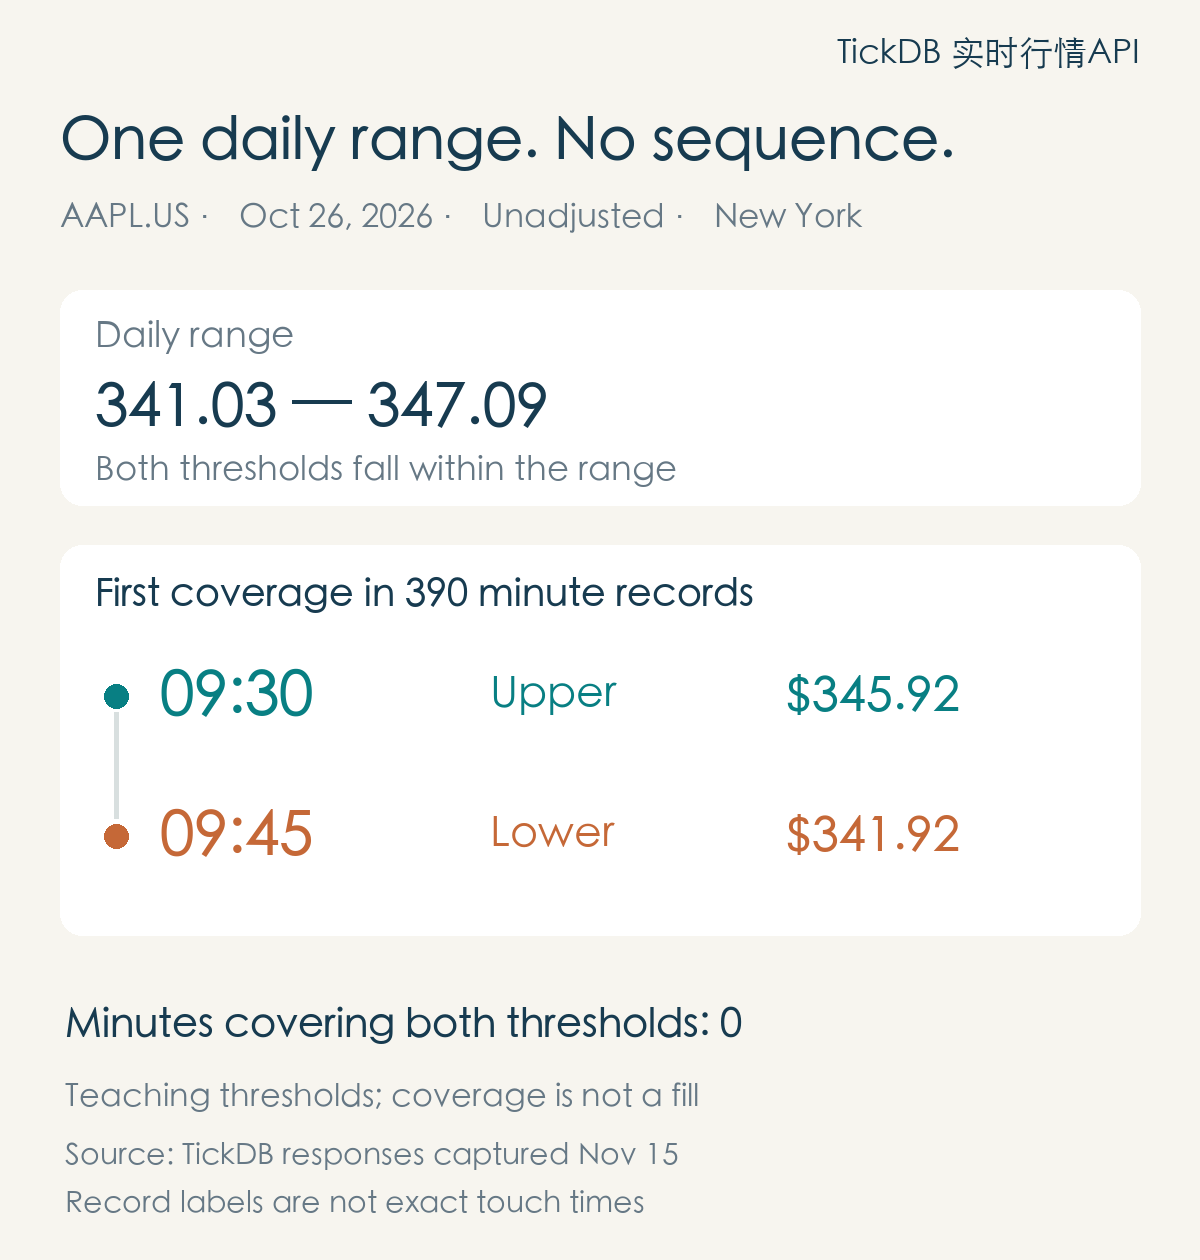
The figure shows record labels and range coverage. A label is not an exact trade time, and a covered price is not an executed order.
Minute data answered the sequence question in this sample. If both thresholds occur within one minute's range, that minute still contains unresolved paths. Obtain finer evidence or explicitly model the ambiguity, for example with conservative handling and sensitivity analysis. Even tick data alone does not establish queue position or executable fills.
A second check changed our trial questions
The final minute close before 16:00 was 343.98, compared with a daily close of 343.91. Including the record labelled 16:00 aligned the aggregated open, high, low and close with the daily bar. The mechanism of that boundary record remains unverified; we did not label it an auction.
Volume still differed:
| Returned scope | Volume field or sum |
|---|---|
| Daily bar | 42,743,575.651348 |
| Regular minutes plus the 16:00 record | 25,694,200.594217 |
| 875 returned minutes, 04:00 to before 20:00 | 29,103,829.558110 |
The discrepancy remains unexplained. Expanding the observation window did not resolve it. For a price-coverage question, the sample remains informative; for volume signals, VWAP or liquidity research, the supplier must clarify units, aggregation and scope before those fields are accepted.
Turn a research question into a purchase test
| Needed decision | First candidate | What to verify |
|---|---|---|
| Signal after the close, execution at a subsequent allowed time | Daily bars | Adjustments, history and execution convention |
| Order of intraday conditions | Minute bars initially | Same-bar ambiguity, sessions and labels |
| Sequence inside a minute | Finer records or explicit uncertainty handling | Remaining unobservable paths |
| Executable prices | Trades, quotes and an execution model | Spread, slippage and queue assumptions |
| Volume or VWAP | Explained volume-and-price fields | Units and aggregation reconciliation |
Granularity determines what can be observed; history length determines which periods can be studied. Neither substitutes for the other.
TickDB supplied the historical inputs in this case. Its REST K-line interface let us request daily and minute bars for the same symbol with the same adjustment setting. Check your own permissions, date-range access and available history during a trial. One sample does not validate a complete archive. The TickDB US stock market data page provides the relevant entry point.
Recalculate the two quoted intervals
The following runnable excerpt uses two real records. It checks only their range coverage; the first-occurrence result above came from scanning all 390 records.
from decimal import Decimal as D
rows = [("09:30", "346.215", "343.42"),
        ("09:45", "342.38", "341.83")]
upper, lower = D("345.92"), D("341.92")
for label, high, low in rows:
    print(label, D(low) <= upper <= D(high),
          D(low) <= lower <= D(high))
09:30 True False
09:45 False True
Ask a candidate provider for the day, session and adjustment convention that your research needs. Keep the observations, the decision they support and the questions still open. That is a more useful trial outcome than an unqualified checkmark next to “minute data available.”
Sources: TickDB K-line documentation and frozen AAPL.US daily/minute responses, captured November 15, 2026; offline checks November 16. The day was selected for diagnosis, not as a random strategy-performance sample.