Anthropic IPO: Add Tech Exposure? A U.S. Stock Minute Data API Replay
TickDB Research ·
Abstract: ANT’s first Nasdaq trade was 34.34% above the Anthropic IPO price. Did the tech holdings in your portfolio follow? Use TickDB’s U.S. stock minute data API to align QQQ and Nvidia with ANT’s first trade, mark a hypothetical $10,000 position and build a reusable event watchlist.
You already hold QQQ and Nvidia. At 11:48:24 a.m. in New York, Anthropic’s first trade crosses at $111.50, 34% above its offer price. You’re considering adding to your tech exposure. Does that opening print give you any new evidence about the stocks you already own?
The opening premium prices ANT. A portfolio decision calls for a second check: how your own holdings traded around that print. Here’s what was observable at each point and what the subsequent price moves would have meant for an illustrative position.
What did you know at the first trade?
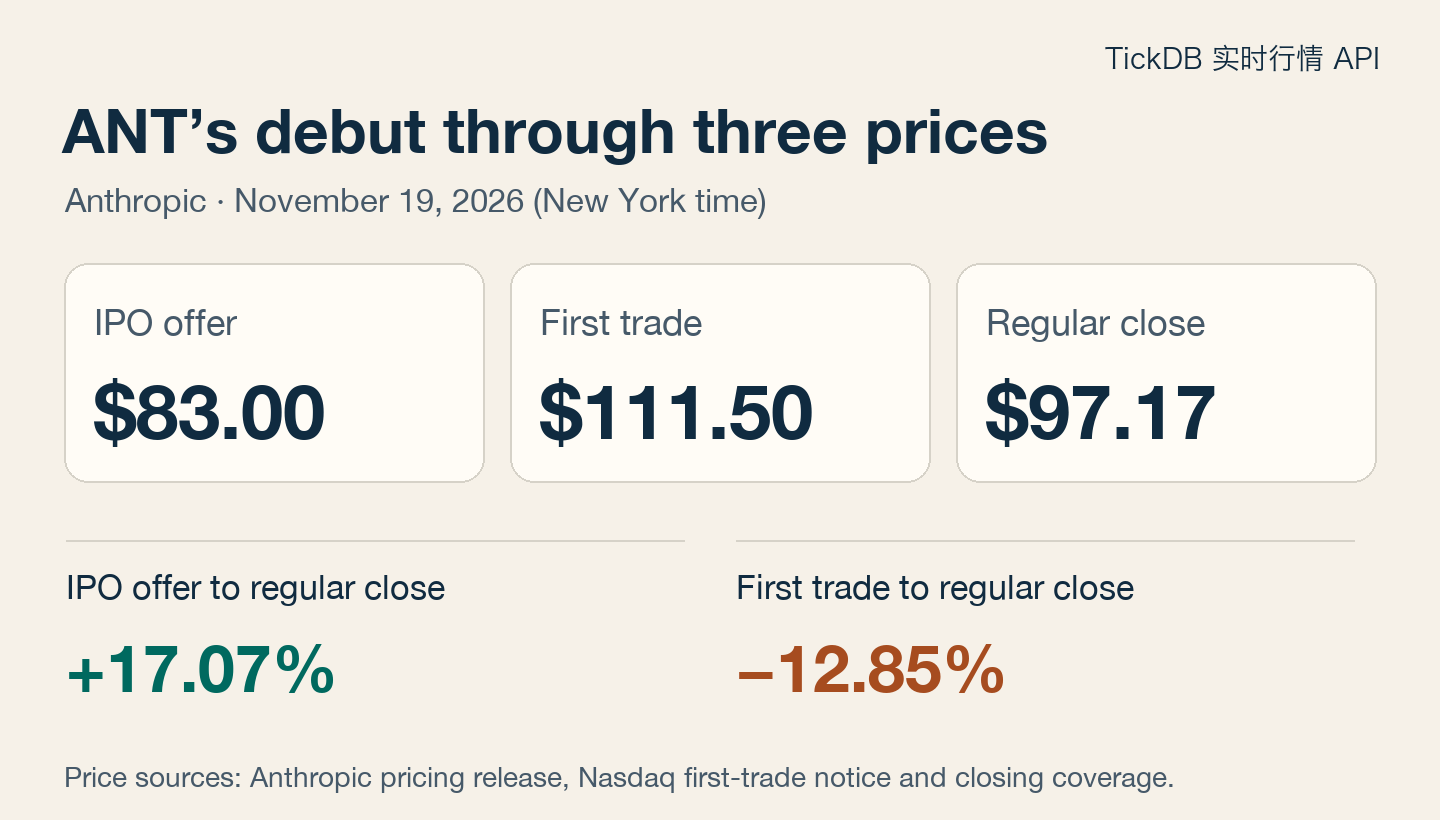
| Reference price | USD per share | When to use it |
|---|---|---|
| IPO offer | $83.00 | Measuring the move from an allocation at the offer price |
| First public trade | $111.50 | Measuring the move after public trading began |
| Regular-session close | $97.17 | The endpoint of both comparisons |
At the first trade, the observable premium was $111.50 ÷ $83 − 1, or 34.34%. At the close, ANT was up 17.07% from the offer and down 12.85% from the opening print. For a position in ANT itself, use your own execution price, position size and costs.
Did QQQ and Nvidia follow?
Nasdaq recorded ANT’s first trade at 11:48:24 a.m. New York time on November 19, 2026. QQQ, an ETF that tracks the Nasdaq-100, provides a market comparison. Nvidia adds a look at a single AI infrastructure stock. For each instrument, start with its 11:47 a.m. bar close, the last completed minute before ANT’s first trade.
| New York time | QQQ | Nvidia |
|---|---|---|
| 11:47 bar close, used as the baseline | $662.90 | $152.78 |
| 11:48 bar close, the bar containing ANT’s first trade | +0.12% | +0.09% |
| 11:53 bar close | −1.05% | −1.26% |
| 15:59 bar close, the final regular-session minute | −2.69% | −4.43% |
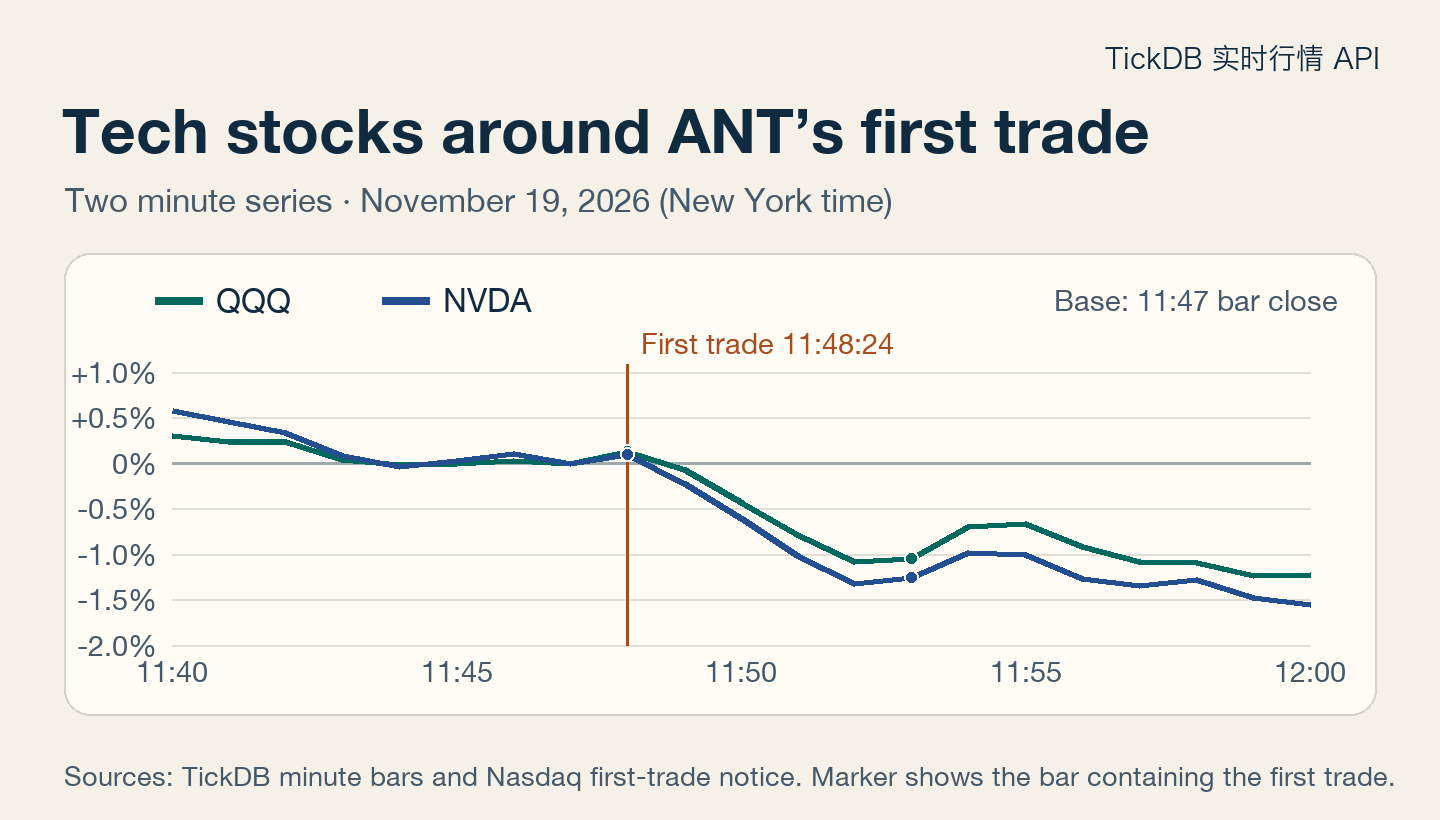
Figure 2. The orange marker identifies the event bar. Each series is measured against its own 11:47 close.
By the end of the 11:47 bar, QQQ was already about 1.17% below its regular-session open and Nvidia was about 0.22% below its own open. The close of the 11:48 bar became observable only after that minute ended. It summarizes an interval around the print, and it cannot establish the order of trades within the minute.
What would the move have meant for your portfolio?
Start with a claim you can check. If you had been considering an increase because you expected tech holdings to keep rising together, look at those holdings over the same window. QQQ and Nvidia both ended the event minute slightly higher. By the end of the 11:53 bar, both were below their own 11:47 reference prices. The initial uptick had already reversed.
As a position-sizing example, take $10,000 of exposure marked at the 11:48 bar closes, with $7,000 in QQQ and $3,000 in Nvidia. Convert each allocation to shares at those reference prices and hold the share counts fixed.
| Marking point (ET bar label) | QQQ contribution | Nvidia contribution | Portfolio change |
|---|---|---|---|
| 11:53 bar close | −$81.66 | −$40.51 | −$122.18 |
| 15:59 bar close | −$196.31 | −$135.47 | −$331.77 |
For the first QQQ mark, multiply $7,000 by (655.97 ÷ 663.713 − 1). Totals use the unrounded contributions. This is a hypothetical mark-to-market calculation at bar-close prices, before costs or currency effects. A live order can fill at a different price.
QQQ also holds Nvidia. Owning NVDA alongside the ETF increases your direct exposure on top of the indirect position in the fund. The two instruments describe what happened to this portfolio. A claim about participation across the entire tech sector would need broader comparisons.
Copy this watchlist table for another IPO. Set the thesis and review window before the event, then fill in the observed outcome.
| Watchlist field | Example |
|---|---|
| Portfolio and thesis | 70% QQQ and 30% NVDA. Check whether both holdings stay above their pre-event levels |
| Exchange time and availability | The first trade occurred at 11:48:24 a.m. ET. Nasdaq Trader posted its notice at 11:50:41 a.m. ET. Record the time your own feed delivers the event |
| Baseline and review window | Use the 11:47 closes for market comparison. For the position example, mark from the 11:48 closes and review at the close of the 11:53 bar |
| Does the thesis still have support? | Both holdings were below their pre-event levels at that review point |
Build a repeatable watchlist with TickDB
The TickDB U.S. stock market data API provides structured quotes and historical bars. For this replay we requested unadjusted 1m bars for QQQ.US and NVDA.US across the same New York regular session. Each response contained 390 consecutive, unique minute labels. Both instruments could therefore use the same UTC millisecond join key and the same close-to-close calculation. For a live watchlist, record when the completed bar actually reaches your system as well. That timestamp determines when the watchlist can show an updated portfolio mark.
The ANT minute query returned an error in this run and in the follow-up check. Its three reference prices came from the issuer’s pricing release, Nasdaq’s opening notice, and closing coverage. A data feature can retain those three values with their own sources, show the ANT minute series as unavailable for this retrieval, and keep the two verified comparison charts available.
| Decision owner | What to specify | Test it against this replay |
|---|---|---|
| Product | Give offer-to-close and first-trade-to-close their own fields, visible labels and source references | Verify that the ANT screen shows both +17.07% and −12.85%, with the correct starting price under each |
| Risk and quant | Freeze the event time, benchmark and comparison window before measuring. Use trade-level evidence for within-minute sequence. Use other events and more sessions for attribution | By the last bar Nvidia trailed QQQ by about 1.75 percentage points, calculated before rounding. Record it as a relative move for that window |
| Engineering | Keep the exchange event timestamp separate from minute-bar labels. Check the session calendar, presence, duplicates and request state before calculating | The two comparator series have 390 bars. The 11:48 bar contains trades around 11:48:24, and its close summarizes that bar. ANT’s minute line stays unavailable for this run |
| Vendor evaluation | Test established instruments and new listings as distinct cases. Ask what can be retrieved on the first day, when missing bars are backfilled and how that status is surfaced | The comparator test succeeded for this session. ANT’s first-day minute availability remains a separate item to verify |
To estimate an IPO’s impact, first specify an estimate of how the stock would normally move without the event. Then test how sensitive your result is to the comparison and the event window. QQQ can respond to the same tech headlines, so this replay uses it as a price reference for the same interval.
Sources
- Anthropic, IPO pricing release, November 18, 2026. SEC, final prospectus, Form 424B4.
- Nasdaq Newsroom and Nasdaq Trader, first-day trading notices, November 19, 2026.
- Reuters and China Securities Journal, first-session closing coverage, November 19–20, 2026.
- TickDB, QQQ and Nvidia minute bars for the November 19, 2026 New York regular session.
- SEC investor bulletin, Investing in an IPO. Invesco QQQ fund overview. A. Craig MacKinlay, Event Studies in Economics and Finance, 1997.