Trailing P/E (TTM): Financial Data API Guide to Adjusted Earnings and Peer Valuation
TickDB Research ·
Abstract: How do you calculate trailing P/E (TTM) for peer valuation without mixing earnings definitions? This financial data API research example combines dated market prices with official Cambricon and Hygon reports to compare reported and adjusted earnings—specifically, parent-attributable income excluding the reports' non-recurring items. The relative reference-multiple gap narrows from 10.33% to 6.34%. Includes a revenue-to-shareholder-earnings decomposition, an earnings sensitivity table and runnable Python.
A peer screen gives you two companies with different P/E ratios. Sorting them takes a second. Explaining the difference takes more work: the earnings denominator can change the comparison before you make any judgment about future growth.
This case study uses two Chinese listed chip designers, Cambricon and Hygon. It produces three concrete findings:
- Cambricon's reference multiple is 10.33% higher using reported net income attributable to parent shareholders. The gap narrows to 6.34% after excluding the non-recurring items identified in the companies' reports.
- Hygon generates approximately 1.74 times Cambricon's trailing revenue, but only 0.79 times its parent-attributable earnings excluding those items.
- At fixed reference equity values, a hypothetical 10% increase in Cambricon's ex-NRI parent earnings reverses the multiple ordering if Hygon's earnings stay unchanged.
The result is a completed research worksheet: a common calculation basis, an explanation of the numerical difference, and a sensitivity test you can reproduce.
1. Define the comparison before calculating P/E
The trailing earnings window runs from October 1, 2025 through September 30, 2026:
Trailing earnings = Q4 2025 earnings + January–September 2026 earnings
Q4 comes from the annual report's quarterly data table; January–September comes from the year-to-date column of the third-quarter report. These periods cover twelve consecutive months without overlap. Substituting the standalone third quarter would omit January–June.
For equity value, this example multiplies each stock's November 17, 2026 unadjusted close by its disclosed September 30 share-count baseline. Subsequent share-capital and treasury-share changes have not been individually reconciled. These are therefore fixed-basis reference equity values, not verified exact market capitalizations on November 17 or the P/E figures displayed by a quote vendor.
| Input | Common basis |
|---|---|
| Price | November 17, 2026 unadjusted daily close |
| Shares | September 30, 2026 disclosed share-count baseline |
| Earnings window | October 2025–September 2026 |
| Earnings ownership | Attributable to shareholders of the listed parent |
| Currency | CNY; financial tables below use CNY billions unless stated otherwise |
Two earnings definitions are retained. “Reported parent earnings” means net income attributable to parent shareholders. “Ex-NRI parent earnings” means that same ownership basis after excluding non-recurring items as defined in the company reports—the Chinese disclosure line 扣非归母净利润. It is not a substitute for an unspecified vendor's “adjusted EPS.” Excluding these items does not guarantee that the remaining earnings will recur.
Both companies are candidates for a chip-design research comparison, but their product mixes differ. Cambricon's annual report describes cloud and edge intelligent-chip products; Hygon's annual-report summary describes CPU and DCU products. A consistent calculation does not make their businesses identical.
2. Changing the earnings definition narrows the gap
| Metric | Cambricon, 688256.SH | Hygon, 688041.SH |
|---|---|---|
| Unadjusted closing price, CNY | 904.80 | 182.54 |
| Disclosed share baseline | 628,854,008 | 2,324,338,091 |
| Reference equity value, CNY bn | 568.99 | 424.28 |
| Trailing reported parent earnings, CNY bn | 4.169 | 3.430 |
| Trailing ex-NRI parent earnings, CNY bn | 3.874 | 3.072 |
| Reference trailing P/E, reported parent basis | 136.48x | 123.70x |
| Reference trailing P/E, ex-NRI parent basis | 146.87x | 138.10x |
Both calculations divide the same reference equity value by earnings. Changing the denominator is the only difference.
The gap between reported and ex-NRI parent earnings is CNY 0.295 billion for Cambricon and CNY 0.358 billion for Hygon. As a share of reported parent earnings, those amounts are 7.07% and 10.43%, respectively.
Hygon loses a larger percentage of its denominator when non-recurring items are excluded, so its multiple rises more. Define the relative multiple gap as Cambricon's reference P/E divided by Hygon's reference P/E, minus one:
Reported parent basis: 10.33% relative multiple gap
Ex-NRI parent basis:    6.34% relative multiple gap
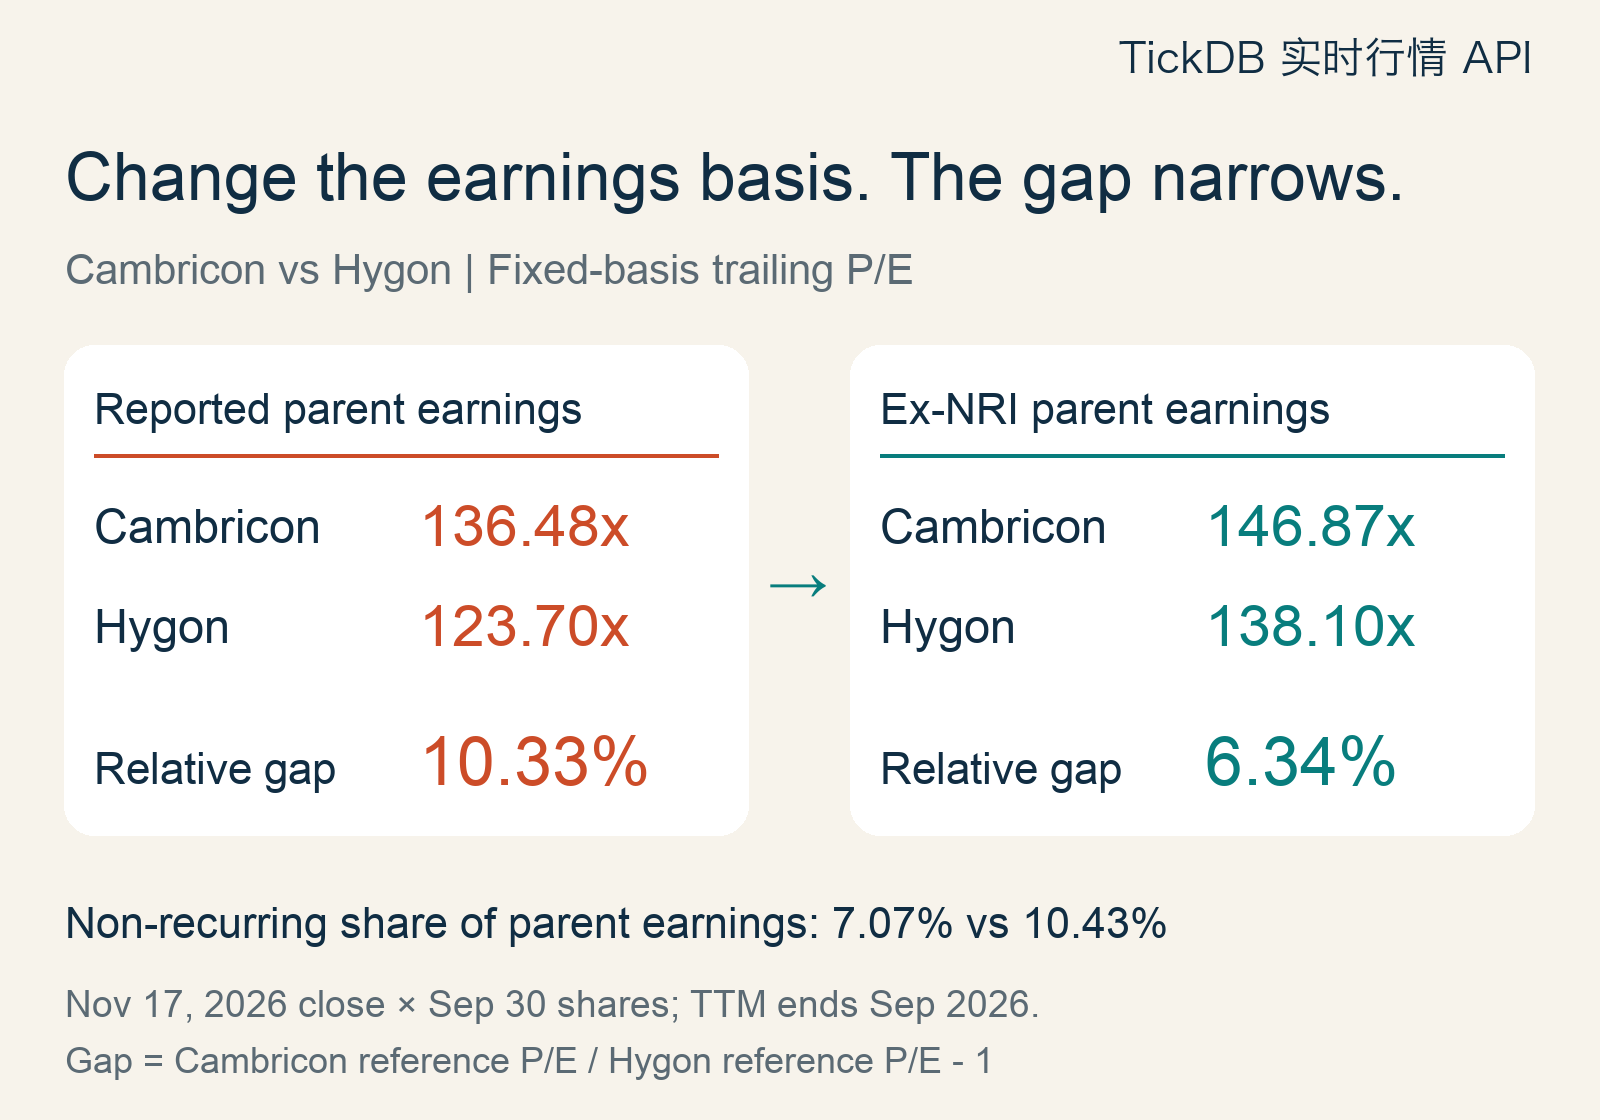
Figure 1. Actual report inputs and unadjusted closes, using the fixed share-count baseline defined above. TTM ends September 2026. Multiples use unrounded inputs.
This completes one part of the explanation: earnings composition accounts for part of the numerical difference. Switching both companies to the ex-NRI definition reduces the gap by approximately four percentage points. It does not establish either company's fair value.
3. Explain why the larger revenue base produces less parent earnings
“Look at fundamentals” is not much of a research output. Connecting revenue and shareholder earnings is more useful.
| Same trailing period | Cambricon | Hygon |
|---|---|---|
| Revenue, CNY bn | 11.416 | 19.842 |
| Ex-NRI parent earnings, CNY bn | 3.874 | 3.072 |
| Ex-NRI parent earnings per CNY 100 of consolidated revenue | 33.94 | 15.48 |
Hygon's revenue is roughly 1.74 times Cambricon's. Its ex-NRI parent earnings per unit of consolidated revenue are lower, however. Combining those two relationships explains the earnings ordering:
Hygon / Cambricon ex-NRI parent earnings
= Revenue ratio × ratio of ex-NRI parent earnings to revenue
≈ 1.74 × (15.48 / 33.94)
≈ 0.79
The larger revenue base does not offset the difference in this shareholder-earnings outcome ratio. The valuation denominator is the earnings attributable to parent shareholders, rather than revenue alone.
The CNY 33.94 and CNY 15.48 figures are deliberately not labelled consolidated net margins. Their numerators exclude non-recurring items and non-controlling shareholders' earnings; their denominators are consolidated revenue. Product mix, expenses, taxes and ownership structure may all affect the result. This decomposition explains the accounting outcome without identifying a single operating cause or establishing superior technology or production efficiency.
It also connects directly to the valuation table. Cambricon's reference equity value is about 1.34 times Hygon's, while its ex-NRI parent earnings are about 1.26 times Hygon's. Dividing the two ratios leaves the 6.34% multiple gap. The equity-value difference on its own overstates the difference between their earnings multiples.
4. Test how much earnings change would alter the ordering
Keep both reference equity values fixed and vary only ex-NRI parent earnings. The first row is the actual baseline; the remaining rows are hypothetical sensitivities, not forecasts.
| Scenario | Cambricon earnings change | Hygon earnings change | Cambricon reference P/E | Hygon reference P/E |
|---|---|---|---|---|
| Actual baseline | 0% | 0% | 146.87x | 138.10x |
| Cambricon only increases | +10% | 0% | 133.51x | 138.10x |
| Hygon only increases | 0% | +10% | 146.87x | 125.55x |
| Cambricon only decreases | -10% | 0% | 163.18x | 138.10x |
| Both increase | +10% | +10% | 133.51x | 125.55x |
A 10% earnings increase divides P/E by 1.10; it does not subtract 10% from the multiple. A 10% decline divides it by 0.90, so the effects are asymmetric.
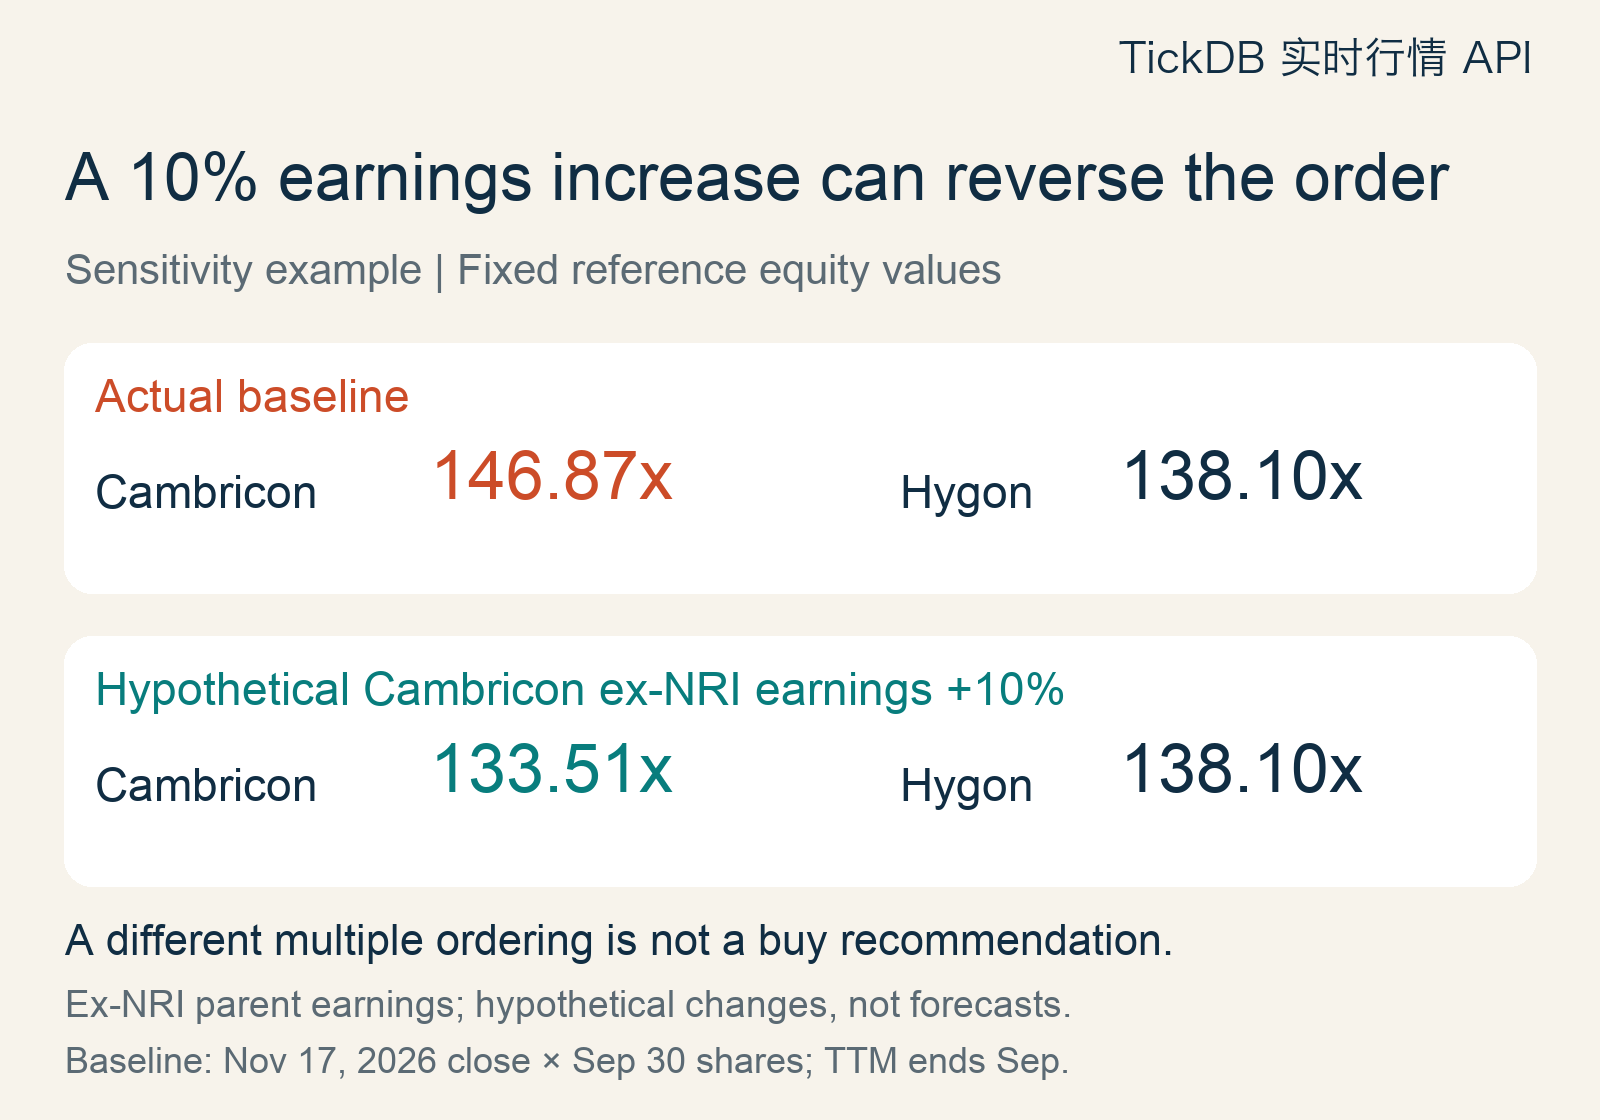
Figure 2. Cambricon's reference P/E falls to 133.51x versus Hygon's unchanged 138.10x. The 10% earnings change is hypothetical.
Solving for equal multiples gives a more precise threshold. With both reference equity values fixed and Hygon's earnings unchanged, Cambricon's ex-NRI parent earnings would need to increase by approximately 6.34% from this baseline to equalize the multiples.
That is an algebraic threshold, not market-implied earnings growth, a required return or a price target. If both companies' earnings rise by the same percentage, their multiple ordering remains unchanged. The useful research question is which business and ownership outcomes could support different earnings paths, rather than whether one fixed ratio is lower today.
5. Save the completed research findings
| Research question | Completed finding | Useful follow-up |
|---|---|---|
| Does earnings composition affect the comparison? | The gap falls from 10.33% to 6.34% on the ex-NRI basis. | Read the non-recurring-item schedules. |
| Does more revenue mean more shareholder earnings? | Hygon has 1.74x the revenue but about 0.79x the ex-NRI parent earnings. | Separate product, expense, tax and ownership effects. |
| How sensitive is the ordering? | A Cambricon-only hypothetical 10% earnings increase reverses it. | Update disclosed earnings and prices separately. |
Where market-data and financial-data APIs fit
A financial data API can structure security identifiers, reporting periods and financial metrics. A price interface supplies the dated market input. The join needs consistent identity, currency and time definitions.
For this example, actual TickDB MCP get_kline calls requested each security's November 17 daily candle with interval="1d" and adjust="none". The returned closes were CNY 904.80 and CNY 182.54. Earnings were entered from the formal company reports. Saving those inputs separately makes subsequent changes explainable.
The TickDB A-share market data API is a relevant starting point for organizing the market-data side of this workflow. This two-security example demonstrates a dated retrieval and calculation; it makes no wider claim about field availability or performance.
6. Reproduce the calculation in Python
The script below uses only the Python 3 standard library. It replays the captured historical sample without an API key or network request, prints both earnings definitions and the sensitivity cases, and exports pe_research_en.csv. All inputs remain in CNY and shares; rounding is applied only to displayed results.
| Financial input, CNY | Q4 2025 | January–September 2026 |
|---|---|---|
| Cambricon revenue | 1,889,771,835.02 | 9,526,401,914.25 |
| Cambricon parent earnings | 454,582,794.56 | 3,714,522,759.80 |
| Cambricon ex-NRI parent earnings | 351,046,180.38 | 3,523,141,104.43 |
| Hygon revenue | 4,886,914,645.83 | 14,954,710,229.13 |
| Hygon parent earnings | 583,444,466.10 | 2,846,508,812.66 |
| Hygon ex-NRI parent earnings | 487,963,593.86 | 2,584,242,015.98 |
"""Python 3 standard library. Reproduce the fixed historical sample offline.
Prices: TickDB unadjusted daily closes for Nov 17, 2026; collected Nov 18.
Shares: disclosed Sep 30, 2026 baseline; reference values are not exact current market caps.
Financials: Q4 2025 + Jan-Sep 2026. All monetary inputs are in CNY.
"""
from decimal import Decimal as D, ROUND_HALF_UP
import csv

DATA = [
    dict(name="Cambricon", code="688256.SH", close="904.80", shares="628854008",
         revenue_q4="1889771835.02", revenue_ytd="9526401914.25",
         parent_q4="454582794.56", parent_ytd="3714522759.80",
         adjusted_q4="351046180.38", adjusted_ytd="3523141104.43"),
    dict(name="Hygon", code="688041.SH", close="182.54", shares="2324338091",
         revenue_q4="4886914645.83", revenue_ytd="14954710229.13",
         parent_q4="583444466.10", parent_ytd="2846508812.66",
         adjusted_q4="487963593.86", adjusted_ytd="2584242015.98"),
]

def fmt(x):
    return str(x.quantize(D("0.01"), rounding=ROUND_HALF_UP))

results = []
for item in DATA:
    r = {k: D(v) for k, v in item.items() if k not in ("name", "code")}
    r["reference_value"] = r["close"] * r["shares"]
    for key in ("revenue", "parent", "adjusted"):
        r[key] = r[key + "_q4"] + r[key + "_ytd"]
    r["pe_parent"] = r["reference_value"] / r["parent"]
    r["pe_adjusted"] = r["reference_value"] / r["adjusted"]
    r["nonrec_pct"] = (r["parent"] - r["adjusted"]) / r["parent"] * 100
    r["adjusted_revenue_pct"] = r["adjusted"] / r["revenue"] * 100
    results.append(r)
    print(item["name"], "reported_parent_PE=" + fmt(r["pe_parent"]),
          "ex_NRI_parent_PE=" + fmt(r["pe_adjusted"]),
          "ex_NRI_parent_income_to_revenue=" + fmt(r["adjusted_revenue_pct"]) + "%")

cam, hygon = results
for key in ("pe_parent", "pe_adjusted"):
    print(key, "relative_multiple_gap=" + fmt((cam[key] / hygon[key] - 1) * 100) + "%")

# Hypothetical changes to ex-NRI parent earnings at fixed reference equity values; not forecasts.
scenarios = [("Baseline", "0", "0"), ("Cambricon+10%", "0.10", "0"),
             ("Hygon+10%", "0", "0.10"), ("Cambricon-10%", "-0.10", "0"),
             ("Both +10%", "0.10", "0.10")]
for label, a, b in scenarios:
    print(label, fmt(cam["pe_adjusted"] / (1 + D(a))),
          fmt(hygon["pe_adjusted"] / (1 + D(b))))
threshold = (cam["pe_adjusted"] / hygon["pe_adjusted"] - 1) * 100
print("Cambricon earnings increase for equal multiples, Hygon unchanged=" + fmt(threshold) + "%")

# Export full-precision inputs and intermediate results; round only for display.
rows = [dict(name=item["name"], code=item["code"], **{k: str(v) for k, v in r.items()})
        for item, r in zip(DATA, results)]
with open("pe_research_en.csv", "w", encoding="utf-8-sig", newline="") as f:
    writer = csv.DictWriter(f, fieldnames=list(rows[0]))
    writer.writeheader()
    writer.writerows(rows)
Actual output:
Cambricon reported_parent_PE=136.48 ex_NRI_parent_PE=146.87 ex_NRI_parent_income_to_revenue=33.94%
Hygon reported_parent_PE=123.70 ex_NRI_parent_PE=138.10 ex_NRI_parent_income_to_revenue=15.48%
pe_parent relative_multiple_gap=10.33%
pe_adjusted relative_multiple_gap=6.34%
Baseline 146.87 138.10
Cambricon+10% 133.51 138.10
Hygon+10% 146.87 125.55
Cambricon-10% 163.18 138.10
Both +10% 133.51 125.55
Cambricon earnings increase for equal multiples, Hygon unchanged=6.34%
To reuse the worksheet, replace the two non-overlapping financial periods, same-day unadjusted prices, and explicitly dated share counts. This positive-earnings P/E ordering does not apply to zero or negative earnings; those cases need a different valuation approach.
Sources and scope
- Cambricon 2025 annual report, quarterly data on page 10; 2026 third-quarter report, year-to-date data on page 1 and share capital on page 8.
- Hygon 2025 annual-report summary, quarterly data on page 13; 2026 third-quarter report, year-to-date data on page 1 and share capital on page 8.
- Both third-quarter reports state that they are unaudited. The cited official PDF paths carry October 24 and October 20, 2026 dates, respectively; those path dates are not treated as independently verified first-publication timestamps.
- Unadjusted daily closes retrieved through TickDB MCP on November 18, 2026 for November 17. The daily bar label identifies the trading date, not a trade or receipt timestamp.
- Reference multiples use the disclosed September 30 share-count baseline, not a fully reconciled November 17 market cap. This historical case study is not a point-in-time backtest dataset. Sensitivities are assumptions, not earnings forecasts or investment recommendations.